Written by: Doug Camplejohn, CEO & Co-Founder, Coffee | Last updated: September 8, 2026
Key Takeaways
- Pipeline changes and trends show how deals move through stages over time. This movement reveals conversion rates, velocity, and forecast accuracy that static snapshots miss.
- 44% of executives cite poor pipeline management as a revenue miss driver, often because they rely on static views built on incomplete historical data.
- Key metrics for pipeline health include stage-to-stage conversion rates, pipeline velocity, stalled deals, forecast deltas, and win/loss ratios.
- Effective tools capture historical snapshots automatically, visualize week-over-week trends, integrate with existing CRMs, and reduce manual data entry for reps.
- Start automating your pipeline reviews with Coffee and replace manual inspections with week-over-week intelligence.
The Challenge Of Tracking Pipeline Changes And Trends
A pipeline snapshot shows what deals exist today. It does not explain how they got there, which deals are stalling, or where your forecast is quietly slipping. 44% of executives report poor sales pipeline management as a driver of missed revenue targets, and static views built on incomplete data sit at the center of that problem.
Accurate forecasting requires visibility into movement over time. Sales managers and RevOps leaders need to see deals progressing, stalling, or slipping across weeks and months. This guide compares leading tools for tracking sales pipeline changes and trends, with a focus on historical data capture, automation, trend visualization, and forecasting strength.
Explore Coffee’s pricing to see how automated, week-over-week intelligence can replace manual pipeline reviews.
What To Track: Key Metrics For Pipeline Changes And Trends
Effective pipeline trend tracking starts with a clear set of metrics for pipeline health and forecast reliability.
- Stage-to-Stage Conversion Rate: The percentage of deals moving from one stage to the next. Tracking conversion at each pipeline stage is more useful than a single aggregate rate. Look at lead-to-opportunity, opportunity-to-proposal, and proposal-to-close separately. A declining rate between specific stages signals a bottleneck.
- Pipeline Velocity: How fast deals move through your pipeline. It is calculated as (number of qualified deals × average deal value × win rate) ÷ sales cycle length in days. A slowing velocity warns of friction in your sales process before forecast misses appear.
- Stalled Deals: Opportunities sitting in a single stage longer than your target timeframe. A deal is genuinely stuck when it sits in the same stage for longer than 2x the average cycle length for that stage with no recent buyer activity.
- Forecast Deltas: Changes in expected revenue from week to week. As one analysis notes, velocity alerts should trigger when components move, not only when the final score drops. A 10% decline in win rate or a sudden increase in stage duration can signal future revenue risk before the combined velocity number becomes alarming.
- Win/Loss Ratios: The proportion of closed deals won versus lost. Shifts in this ratio over time highlight changes in competitive positioning, pricing, or lead quality.
Healthy pipeline coverage benchmarks sit at 3x–4x quota. Teams that monitor stage conversion improve forecast accuracy by up to 20%, and those that update forecasts weekly see a further 10–15% gain.
How To Evaluate Tools For Pipeline Trend Tracking
Pipeline tools vary widely in how they handle change tracking and trend analysis. Use these criteria to compare options.
- Historical Data Capture: The tool should store snapshots of your pipeline over time, not just the current state. Without historical data, trend analysis is impossible.
- Trend Visualization: Strong tools generate week-over-week comparisons natively. If you must export to spreadsheets for analysis, adoption and insight both suffer.
- Automation: Look for automatic logging of changes from emails, calls, and calendar events. Heavy reliance on manual rep updates leads to gaps.
- CRM Integration: The tool should work with your existing Salesforce or HubSpot instance when you already have a system of record. Forced migrations slow teams down.
- Forecasting Capabilities: The best tools project future revenue based on historical patterns and current pipeline movement, not just static totals.
- Rep Adoption: As one analysis notes, the root cause of inaccurate pipeline data is usually manual data entry. A tool reps find burdensome will produce bad data regardless of its analytical features.
Comparison: Best Tools To Track Sales Pipeline Changes And Trends
The table below evaluates each tool on three dimensions: its primary fit, its approach to historical data capture, and its level of automation. Qualitative descriptors appear where direct metric comparison is not possible.
| Tool | Best Fit | Historical Data Capture | Automation Level |
|---|---|---|---|
| Salesforce | Enterprise teams needing deep customization | Daily snapshots; 3-month native retention; limited to 5 snapshot dates and 20 tracked fields per object | Low, requires manual entry or third-party automation |
| HubSpot | Growing teams using HubSpot's ecosystem | No single native historical snapshot system; week-over-week comparison requires custom reports or workarounds | Medium, workflow automation available but requires setup |
| Pipedrive | Small teams needing simple visual pipelines | Current-state view; limited native historical trending | Medium, activity logging requires rep participation |
| Gong | Teams needing conversation intelligence | Call and conversation data; requires a CRM underneath for deal-stage history | High for call data, requires Gong's recording layer |
| Clari | Enterprise revenue teams focused on forecasting | Pipeline flow visualization over time; inherits gaps from underlying CRM data quality | Medium, depends on CRM data quality to function accurately |
| Coffee | SMB and mid-market teams wanting automated pipeline intelligence | Built-in data warehouse captures full history automatically; Pipeline Compare shows week-over-week changes without manual exports | High, AI agent logs every interaction without manual entry |
Use this overview as a starting point. The next section walks through each tool’s strengths and tradeoffs in more detail.
Deep Dives: Top Tools For Pipeline Changes And Trends
Salesforce: Pipeline Inspection And Historical Trending
Salesforce Pipeline Inspection is a Sales Cloud workspace that consolidates open opportunities, forecast category totals, recent changes, activity indicators, and deal-level signals. Change indicators show which opportunities are new, increased, decreased, moved in, moved out, won, or lost during a selected period.
The limitations come from how Salesforce stores history. Native historical trend reporting retains data for only three months, captures only daily snapshots, and is limited to 20 tracked fields per object and comparisons across up to five snapshot dates. Pipeline Inspection exposes bad data faster, but it cannot fix unclear stage definitions or missing activity discipline.
HubSpot: Pipeline Analytics And Forecasting
HubSpot users frequently seek help comparing week-over-week pipeline states. Native functionality does not fully address this recurring need, so teams often build custom reports, configure workflow-based stale deal alerts, and rely on third-party apps for deeper historical trend visualization.
HubSpot's AI forecasting, available in Sales Hub Enterprise, analyzes historical deal patterns such as time in stage, rep close rate, and engagement signals to produce forecasts. Companies with 200+ closed deals often see AI forecast accuracy within 10–15% of actual close, while those with fewer than 100 deals experience more variance.
Pipedrive: Visual Pipeline Management
Pipedrive focuses on visual pipeline management for small sales teams. Its drag-and-drop interface makes deal progression intuitive, and activity reminders help reps stay on top of follow-ups. Like other legacy CRMs, Pipedrive relies on reps to manually log activities and update stages. Trend analysis suffers directly when reps do not consistently update deals.
Gong: Revenue Intelligence From Conversations
Gong analyzes conversation data to surface pipeline risks early. It detects competitor mentions, budget signals, and deal risks in calls that might not appear in CRM data. It functions as a revenue intelligence layer rather than a full pipeline management system. Teams running Gong alongside Salesforce or HubSpot gain conversation-level insights but still face the manual data entry problem in their underlying CRM.
Clari: Forecasting And Pipeline Movement
Clari's Flow feature visualizes pipeline movement over time, showing deals as they progress, stall, or slip. Enterprise forecasting platforms like Clari commonly require 8–16 weeks to deploy with professional services fees of $15K–$75K. Clari's forecasts inherit data gaps from the underlying CRM. When reps fail to log activities and update stages, the platform amplifies those gaps instead of closing them.
Coffee: Automated Pipeline Intelligence With Pipeline Compare
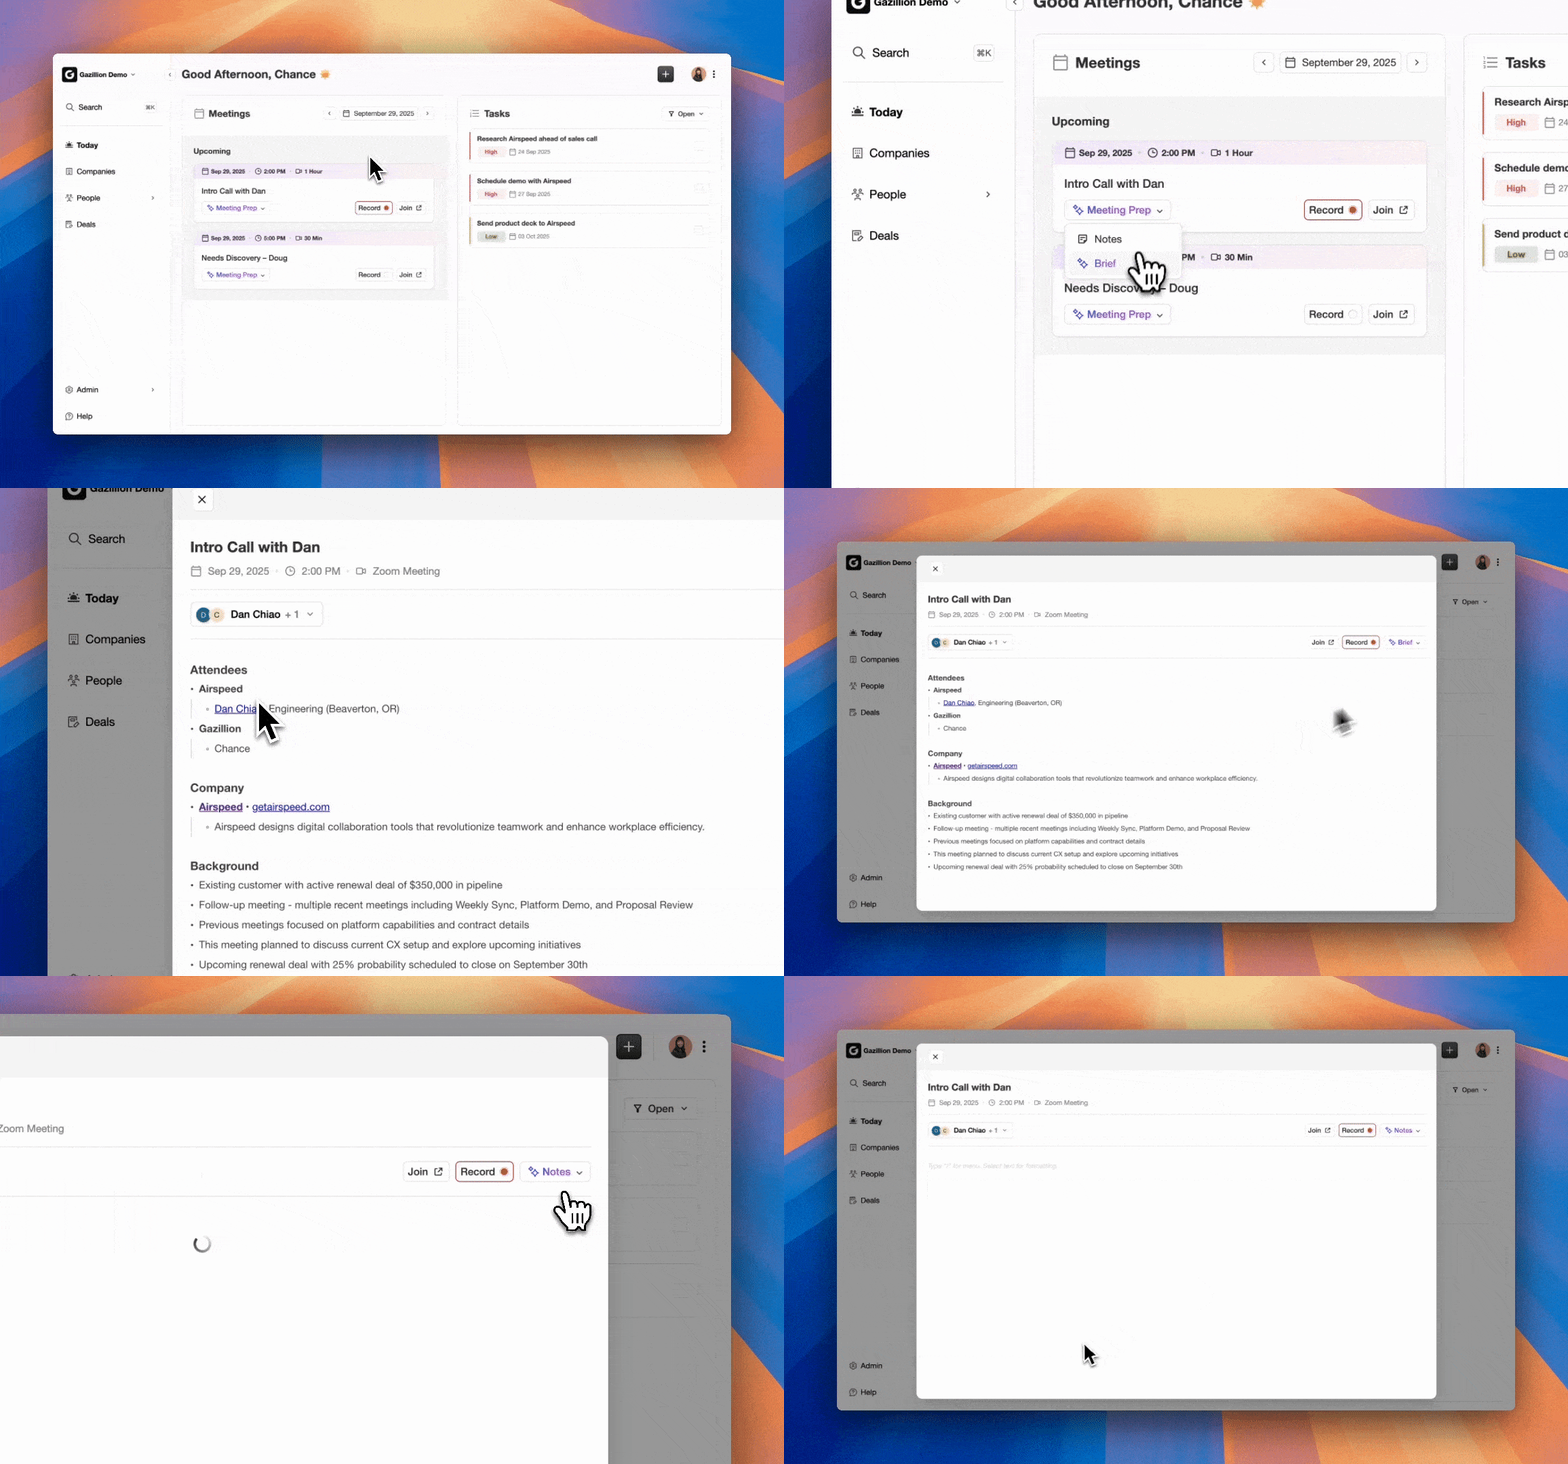
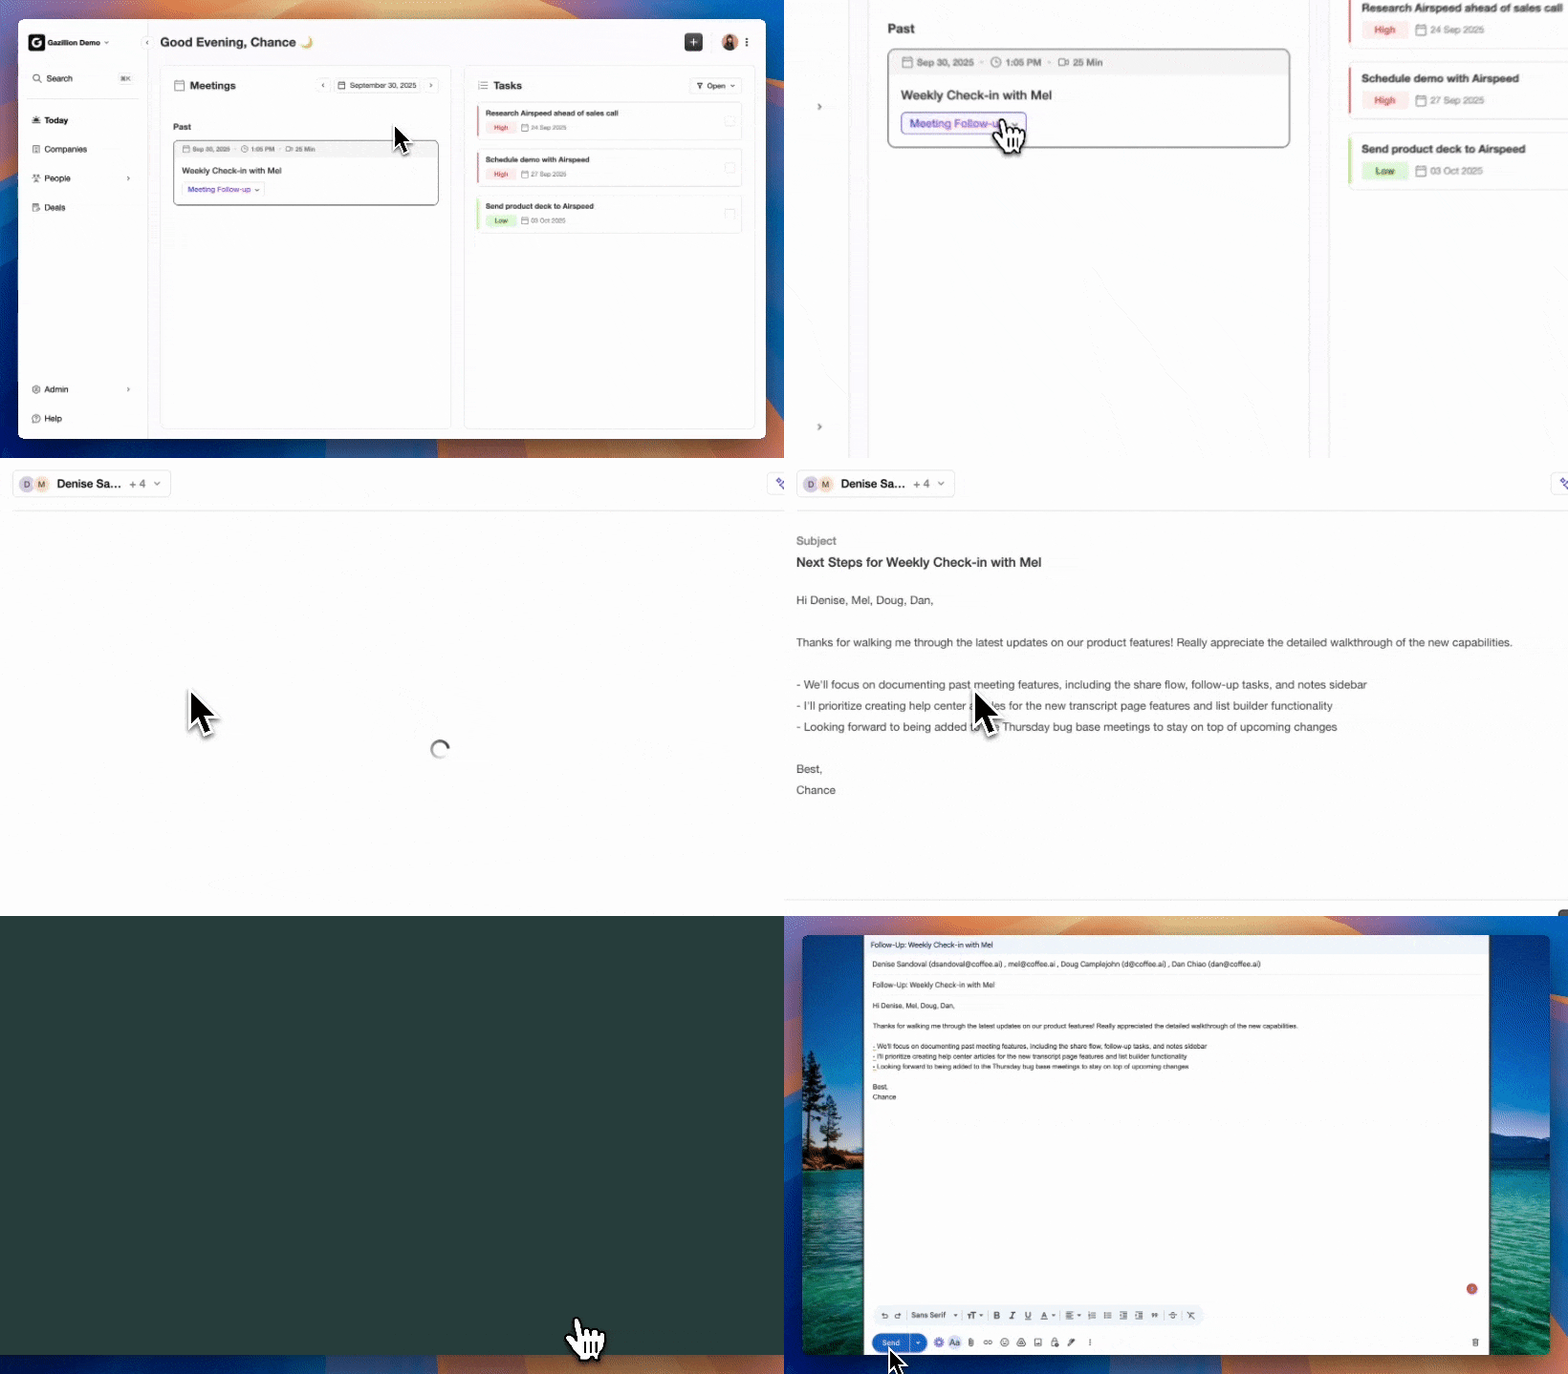
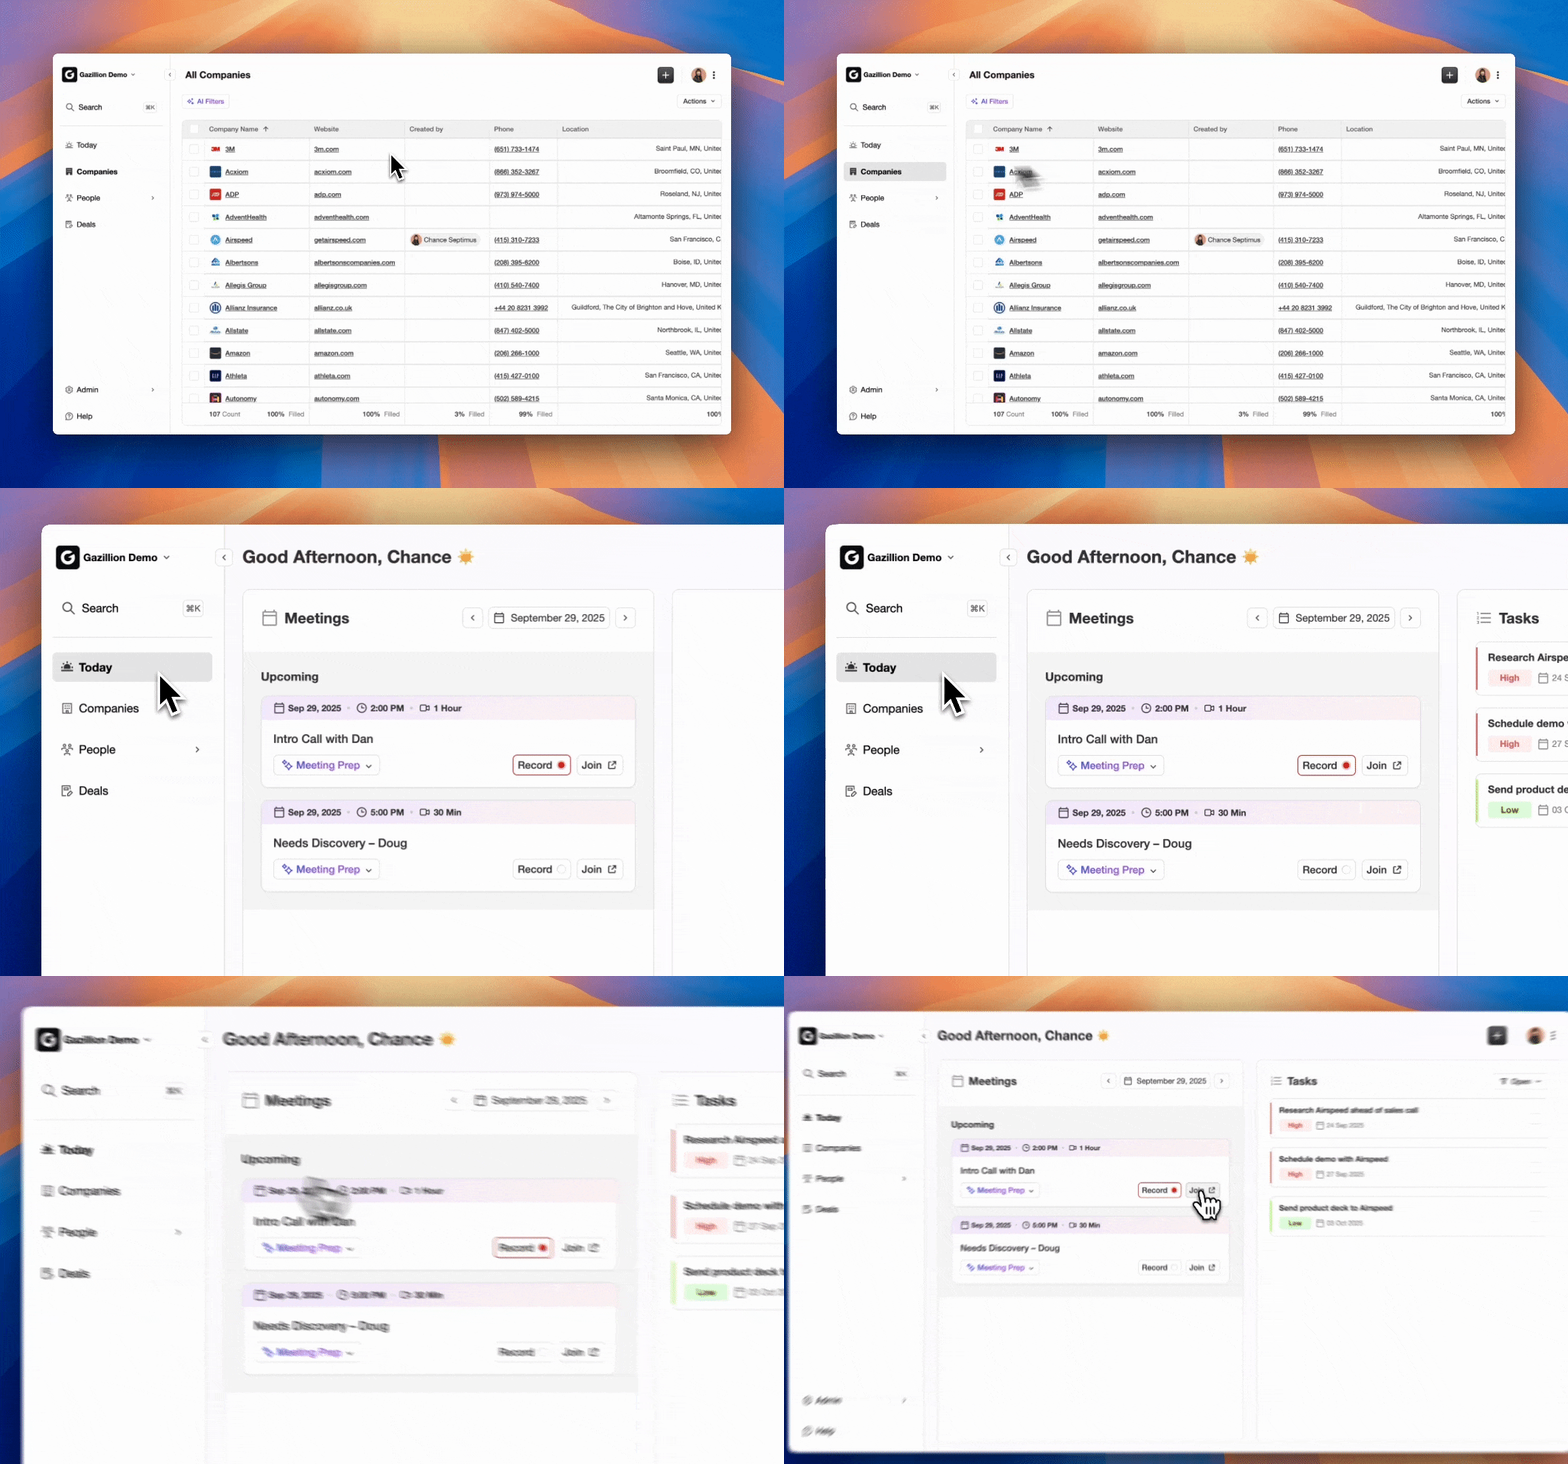
Coffee takes a different approach to pipeline data. Coffee's AI agent automatically captures every interaction and writes it to the CRM, eliminating the need for reps to manually log activities. It records emails, calls, meetings, and calendar events. Coffee's AI search on deals answers natural-language questions such as “Which deals are stuck in negotiation?” or “What's closing this month?” Users get these answers without manual data entry or CSV exports.
Coffee's Pipeline Compare feature visualizes week-over-week changes automatically. It highlights progressed deals, stalled opportunities, new additions, and slipped close dates. Because Coffee's agent captures history in a built-in data warehouse, outputting insights stays seamless. Coffee's Stripe integration automatically imports customers and companies, enriches them, and adds paid invoices to deals as Closed Won. This workflow removes an entire category of manual pipeline updates.
Coffee works as a standalone CRM for small teams or as a Companion App on top of Salesforce and HubSpot for mid-market organizations. This flexibility lets teams keep their current systems while gaining automated pipeline intelligence.
Start automating your pipeline data capture with Coffee so your forecasts rely on complete, current information.
How To Choose: Decision Framework Based On Team Size And Forecasting Needs
Team size, existing systems, and forecasting expectations should guide your choice of pipeline tool.
- Small teams (1–20 employees) without a CRM: Coffee as a standalone CRM removes the setup burden of legacy systems. The agent handles data entry automatically, so founders and early hires spend their time selling instead of logging.
- Mid-market teams committed to Salesforce or HubSpot: Coffee as a Companion App automates data entry and enhances trend tracking. The agent writes insights back to your existing CRM, improving data quality without forcing reps to change their workflow.
- Enterprises with complex needs: Salesforce and Clari serve large organizations well but require significant admin effort and ongoing data hygiene discipline. These tools work best when dedicated RevOps teams maintain data quality.
Clarify a few points before you decide. Identify your team size and whether you plan to stay with your current CRM. Align on how critical forecasting accuracy is for leadership. Set expectations for how much manual data entry you will accept from reps. Confirm whether you need historical trend data that your current tool does not capture.
Common Pitfalls In Tracking Pipeline Changes And Trends
- Manual data entry leading to stale data. When reps skip logging or batch updates at week's end, pipeline reports show deals untouched for weeks and opportunities in outdated stages. As one analysis notes, manual entry often sits at the root of inaccurate pipeline data.
- Lack of historical snapshots. Salesforce's native historical trend reporting only retains data for three months. That window is too short for year-over-year analysis or understanding long-term pipeline patterns. Many tools only show the current pipeline state, so week-over-week comparison requires manual exports.
- Over-reliance on spreadsheets. Around two-thirds of companies still rely on spreadsheets for sales forecasting. This practice breaks down as pipeline volume grows, lacks real-time updates, and cannot capture the historical context needed for trend analysis.
- Ignoring stalled deals. A deal with no next step is a wish, not a reliable opportunity. Teams that fail to flag and address stalled deals see forecast accuracy decline as inflated pipeline coverage hides real revenue risk.
Future Trends: AI-Driven Forecasting And Pipeline Intelligence
The biggest shift in 2026 moves teams away from manual pipeline updates and spreadsheet reviews toward continuous, automated insight. This shift supports planning accuracy, improves risk prevention, reduces human bias, and saves time for sales reps and managers.
Gartner research finds that the two AI capabilities that most reduce forecasting burden are activity capture and conversation intelligence. The prediction layer comes after that foundation. Gartner also reports that organizations prioritizing sales pipeline quality are 2x more likely to exceed customer acquisition expectations. Teams that invest in data quality first gain the most from AI forecasting.
Agentic AI is expected to be one of the most impactful technologies for sales leaders in 2026 and beyond. Autonomous systems are shifting from assistant to operator. They qualify inbound leads, draft outreach, and recommend deal strategy before human involvement. Coffee's agent-first architecture aligns with this operating model.
Frequently Asked Questions
How Do You Track Pipeline Changes Week Over Week?
Tracking pipeline changes week over week requires comparing current deal states against the previous week's snapshot. Key changes to monitor include deals that progressed to new stages, deals that stalled with no activity for seven or more days, new deals added to the pipeline, deals that slipped close dates, and deals won or lost. Tools like Coffee's Pipeline Compare automate this process entirely and surface all of these changes without manual exports. Manual approaches require pulling CSV snapshots weekly and comparing them in spreadsheets, which is time-consuming, error-prone, and dependent on reps having logged accurate data in the first place.
What Metrics Reveal Pipeline Trends?
The metrics that reveal pipeline trends include stage-to-stage conversion rates, pipeline velocity, stalled deal counts, forecast deltas, and win/loss ratios. Tracking changes in these metrics over time shows whether your pipeline is healthy or deteriorating. Pipeline coverage ratio, defined as total pipeline value divided by quota, is another key metric. Teams should segment velocity by deal type, territory, and rep rather than relying on a single company-wide score, because mixing enterprise and SMB cycles in one number hides operating patterns that matter for coaching and forecasting. Refer back to the 3x–4x coverage benchmark mentioned earlier when setting targets.
What Is The Best Pipeline Forecasting Tool For RevOps?
The best pipeline forecasting tool depends on team size, existing CRM, and data quality. For teams struggling with manual data entry and stale pipeline data, which describes many SMB and mid-market organizations, Coffee's AI agent automates data capture and provides accurate forecasting insights without requiring reps to change their behavior. For enterprise teams with dedicated RevOps resources and existing Salesforce or HubSpot investments, Clari and Salesforce Revenue Intelligence offer powerful forecasting capabilities but require significant implementation effort, ongoing data hygiene discipline, and in Clari's case, substantial deployment timelines and professional services costs. Any forecasting tool needs clean, current data first; without that foundation, even sophisticated AI models amplify gaps instead of closing them.
How Does Salesforce Pipeline Inspection Work?
Salesforce Pipeline Inspection is a Sales Cloud workspace that consolidates open opportunities, forecast category totals, recent changes, activity indicators, and deal-level signals in one view. Change indicators show which opportunities are new, increased, decreased, moved in, moved out, won, or lost during a selected period. The native change view relies on historical trending for comparison, but data retention is limited to three months, snapshots are captured only daily, and field history tracking is capped at 20 fields per object. Pipeline Inspection works best as an interactive deal review workspace during one-on-one or forecast calls. Salesforce reports and dashboards still serve better for scheduled delivery and broader executive reporting.
Can Coffee Work With My Existing CRM?
Yes. Coffee operates in two models: as a standalone AI-first CRM for small to mid-sized businesses, or as a Companion App that works on top of existing Salesforce or HubSpot instances. The Companion App deploys the Coffee Agent as an intelligent layer that handles the data-in process. It automatically captures emails, calls, meetings, and calendar events and writes them back to your system of record, so your CRM remains accurate without human effort. A simple authentication connects the agent to your existing instance, with no full migration required. This approach improves pipeline data quality for teams already committed to Salesforce or HubSpot without asking reps to change their workflow.
Conclusion
Tracking pipeline changes and trends is essential for accurate forecasting. Legacy tools make this difficult because they depend on manual data entry that reps rarely perform consistently. Only 18.7% of sales organizations achieve 75% or higher forecast accuracy, and incomplete or unreliable CRM data plays a major role.
The strongest tools for tracking sales pipeline changes and trends automate data capture, surface week-over-week changes, and provide forecasting insights without turning reps into data entry clerks. Coffee's AI agent addresses the core issue of poor pipeline tracking by improving data quality at the source. By automating data capture and visualizing pipeline changes through Pipeline Compare, Coffee keeps your pipeline aligned with reality so your forecasts can match it.
Turn your pipeline reviews into strategic decisions with Coffee and give your team a clear, current view of revenue risk and opportunity.