Written by: Doug Camplejohn, CEO & Co-Founder, Coffee
Key Takeaways For Salesforce Data Warehouse Reporting
- Salesforce data warehouse reporting depends on moving CRM data into an analytical store such as an external warehouse, Data 360, or the native layer. This shift enables cross-system and historical analysis without slowing down day-to-day CRM usage.
- External warehouses like Snowflake or BigQuery handle complex cross-department analytics and deep historical trends. They also introduce ongoing ETL maintenance and higher Fivetran costs after the 2026 pricing changes.
- Salesforce Data 360 delivers real-time profile unification and Agentforce grounding with native activation. Its consumption-based pricing and dual-meter federation can increase costs quickly when usage grows.
- Native Salesforce reports work well for daily operational tracking but face strict limits on rows, timeouts, and historical retention. These limits cap how far teams can push analytical and historical reporting.
- Coffee automates accurate data entry and captures pipeline history automatically. This foundation helps any Salesforce data warehouse reporting architecture perform more reliably.
Does Salesforce Have A Data Warehouse?
Salesforce does not ship a traditional analytical warehouse with the core CRM. Native Salesforce reports query live CRM data in real time, and Data 360 (renamed from Data Cloud at Dreamforce in October 2025) is a hyperscale unification and activation layer. Data 360 functions as a customer data and activation engine. It does not function as a columnar analytical warehouse.
Native Reports and Dashboards query transactional Salesforce objects directly. They share compute with every other CRM operation, so performance slows as record counts grow. Data 360 ingests structured and unstructured data streams, resolves customer identities, and serves as the grounding layer for Agentforce agents. Its architecture is explicitly framed as bidirectional federation rather than a full replacement for a source warehouse. Neither product stores data in the columnar, query-optimized format that defines a traditional analytical warehouse such as Snowflake or BigQuery. Teams planning Salesforce data warehouse reporting need this distinction clear before they commit to an architecture. Confusion here often leads to overspending on Data 360 credits for workloads that belong in a warehouse or weak investment in the historical capture that makes any architecture useful.
The Three Salesforce Data Warehouse Reporting Options
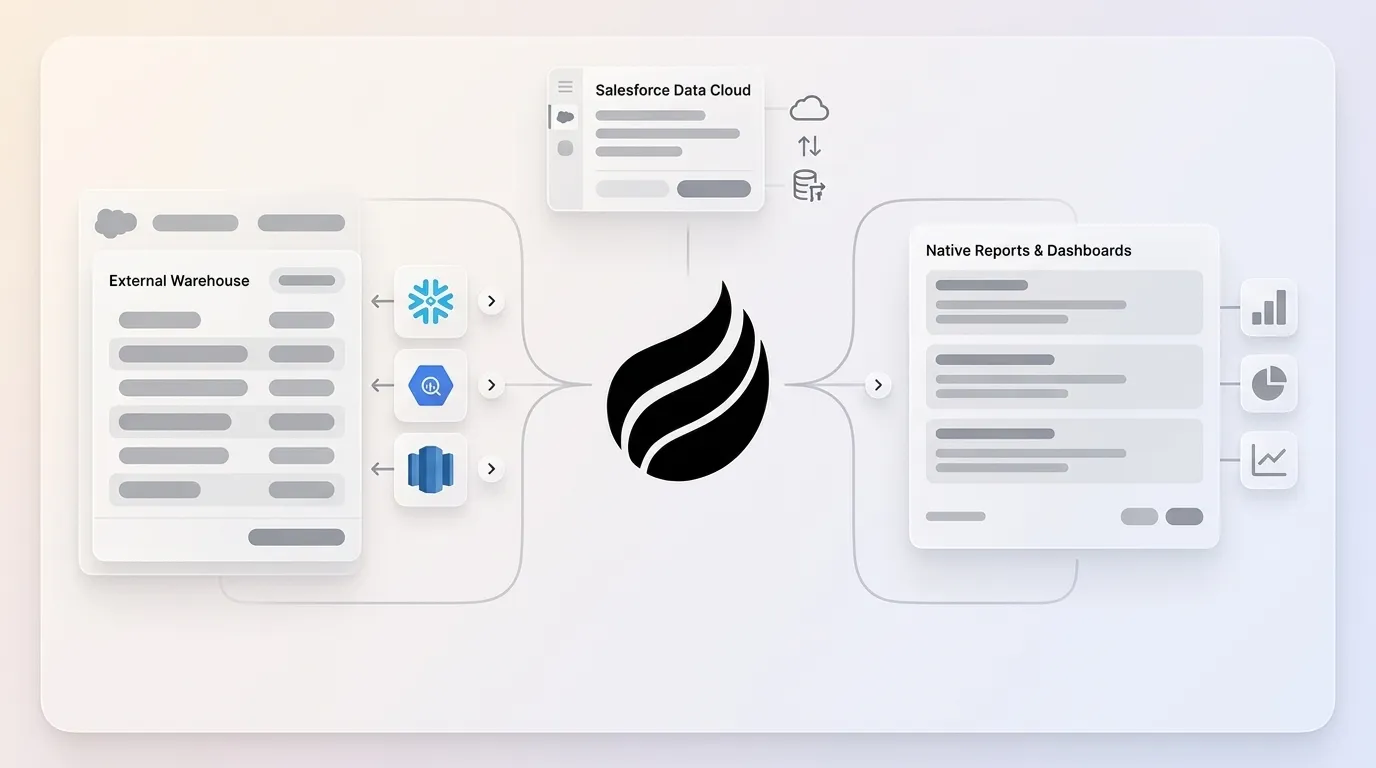
Salesforce data warehouse reporting usually follows three main architectures. Each option uses a different mechanism, fits a specific use case, and carries a hard limitation. The table below summarizes these tradeoffs before the sections that follow explain each option in more detail.
| Option | Mechanism | Best For | Key Limitation |
|---|---|---|---|
| External Warehouse | ETL tools sync Salesforce objects into Snowflake, BigQuery, or Redshift | Cross-departmental analytics, heavy historical trend analysis | Fivetran’s 2026 pricing shift added connector-level MAR charges and fees for deleted rows, and pipeline maintenance remains ongoing |
| Salesforce Data 360 | Native hyperscale engine unifies structured and unstructured data streams inside the Salesforce estate | Real-time profile unification, Agentforce grounding, native activation | Identity resolution can consume up to 100,000 credits per million profiles, and federation bills on both Data 360 and Snowflake meters at once |
| Native Reports & Dashboards | Queries live CRM data using built-in report builder and dashboard components | Day-to-day operational tracking, sales rep performance | 2,000-row display cap, 10-minute timeout, three-month history retention |
External Warehouse (Snowflake, BigQuery, Redshift) Via Fivetran, Airbyte, Or MuleSoft
ETL tools sync Salesforce transactional tables into an enterprise warehouse on a scheduled or near-real-time basis. Fivetran connects to Salesforce through its REST and Bulk APIs with incremental syncing. Airbyte offers over 600 pre-built connectors with zero licensing cost when teams self-host. MuleSoft Anypoint Platform handles bidirectional sync, and carries a median contract cost of $55,150 per year based on verified contract data. Once data lands in the warehouse, dbt handles transformation and a BI layer such as Tableau, Looker, or Power BI serves analysts.
This architecture fits organizations that need complex cross-departmental analytics joining Salesforce with finance, product, or support data. It also suits teams that require historical trend analysis beyond Salesforce’s native three-month window. The real cost is cumulative. Fivetran’s January 2026 pricing changes moved to connector-level Monthly Active Rows, added charges for deleted rows, and set a $5 base per connection. One community report cites costs more than doubling after the change. Because migrating away takes two to four months for a mid-market team, switching tools becomes a slow response once costs rise.
Salesforce Data 360 (Formerly Data Cloud)
Salesforce renamed Data Cloud to Data 360 at Dreamforce on October 14, 2025. The product itself did not change. Data 360 ingests data from Sales Cloud, Service Cloud, Marketing Cloud, and external sources, maps it to a canonical data model, resolves customer identities, and serves as the grounding layer for Agentforce. Salesforce and Snowflake’s bidirectional zero-copy integration went GA in two stages, completing in April 2024, so Data 360 can federate Snowflake tables without duplicating data.
This architecture fits organizations already deep in the Salesforce ecosystem that need real-time profile unification and native activation to Marketing Cloud or Agentforce. The pricing model requires close monitoring. The Data 360 Starter SKU lists at $60,000 per year, and identity resolution can consume 100,000 credits per million profiles processed. Federation bills on both meters at the same time, so an unfiltered segment scanning a billion-row federated Snowflake table appears on two invoices in the same month.
Native Reports & Dashboards
Native reporting queries live CRM data using Salesforce’s built-in report builder, dashboard components, and list views. Teams avoid building an ETL pipeline and do not need extra licenses. This layer works best for operational tracking such as pipeline by rep, activity counts, and case volume by queue.
Performance degrades as object record counts grow. Report performance starts to become a concern when an underlying object grows past 100,000 records, and past a million records timeouts become increasingly common regardless of optimization. The 2,000-row display cap applies to every report format, dashboard components cap at 1,000 groupings, and historical trending retains only three months of data. Native reporting supports operational visibility but cannot carry analytical or long-range historical workloads at scale.
What Are The Four Types Of Reports In Salesforce?
Salesforce offers four standard report formats: Tabular, Summary, Matrix, and Joined.
- Tabular: Lists records in rows and columns with no groupings, subtotals, or charts. This format is the simplest and fastest.
- Summary: Groups records by rows and supports subtotals and charts. It suits aggregated analysis by a single dimension.
- Matrix: Groups data by both rows and columns. It functions like a pivot table for two-dimensional analysis.
- Joined: Combines multiple report blocks in a single view, each with independent filters and columns. This format is the most processing intensive.
All four formats share the same hard limits. The report viewer caps at 2,000 rows across all formats; for summary and matrix reports with details hidden, the cap applies to 2,000 groupings rather than raw rows. Reports time out after 10 minutes in the browser UI. Salesforce Support can extend the timeout to 20 minutes for tabular, summary, and matrix reports. Joined reports are capped at 10 minutes with no extension available. Dashboard components display a maximum of 1,000 groupings, and custom report types have a maximum depth of four objects. These limits sit at the platform level and no admin setting can override them.
The Historical-Data Problem In Salesforce Reporting
Historical data planning often gets skipped in Salesforce warehouse projects, and that gap causes many first attempts to fail. Salesforce objects store current state only. When a field is updated, the prior value disappears from the live record. Capturing history requires deliberate configuration before changes happen, and native mechanisms still impose strict limits.
Salesforce field history tracking captures an audit log of individual field changes, with a limit of up to 20 fields per object and up to 18 months of history. Fields not configured for tracking at setup have no history that teams can reconstruct later. Historical trending takes daily snapshots and retains only the previous three months plus the current month, extended to 12 months for Opportunity data if Pipeline Inspection is enabled. Each object is capped at 5 million rows of historical trending data. Historical trending supports only Opportunities, Cases, Forecasting Items, and up to three custom objects. It tracks a maximum of 8 fields per object. For Opportunities, 5 of those 8 slots are pre-selected (Amount, Close Date, Forecast Category, Probability, Stage), leaving only 3 slots for custom fields.
The gaps compound over time. Deleted opportunities leave gaps in historical reports that are easy to miss, ownership changes create attribution problems, and when picklist values are renamed, removed, or reordered, historical snapshot data referencing the old values becomes inconsistent with current report filters without generating an error. A deal that moved from Stage 3 to Stage 5 and back to Stage 3 between two snapshot dates shows as Stage 3 on both dates, which hides the movement entirely.
The durable fix is continuous extraction into an external store before history ages out. An ETL pipeline that captures every version of every record removes the three-month ceiling and the five-snapshot constraint. Coffee’s built-in data warehouse handles this automatically for Salesforce customers using the Companion App and captures pipeline history without a separate ETL build.
Data Extraction And Integration Options
Teams that build their own extraction pipelines rely on four Salesforce APIs, each suited to a different workload.
- REST API: Returns a maximum of 2,000 records per call and competes with all other API traffic against the same daily allocation. It suits real-time, low-volume operations. Salesforce explicitly states that it does not suit write operations on large batches.
- Bulk API 2.0: Draws on a separate allocation of 15,000 batches per rolling 24 hours, and only ingest jobs consume batches while query jobs avoid this allocation. It is the recommended choice for any extraction above 2,000 records.
- Streaming API / Pub/Sub API: Delivers real-time notifications when records change. Teams should treat it as a complement to bulk replication rather than a replacement for initial loads or historical syncs. Message delivery is guaranteed only for clients connected within the 24-hour replay window.
- Change Data Capture (CDC): Publishes events for create, update, delete, and undelete operations through the Pub/Sub API with no Apex code required. Formula field values are excluded from Change Events entirely.
The most-cited 2026 extraction stack uses Fivetran for raw landing, dbt for staging and mart transformation, and Airflow for orchestration. Airbyte offers a cost-effective alternative for teams willing to self-host. For transformation governance, see the Salesforce Data Warehouse Best Practices playbook.
Automate Salesforce Data Capture With Coffee
The BI And Reporting Layer
Four tools dominate the Salesforce reporting layer today: Tableau, Power BI, Looker, and CRM Analytics. Each plays a different role in the stack.
What Is Tableau CRM Called Now?
Salesforce now calls Tableau CRM “CRM Analytics,” a change introduced in April 2022. The full naming timeline is Wave Analytics (launched October 2014) → Einstein Analytics (2017) → Tableau CRM (late 2020) → CRM Analytics (April 2022–present). The rename from Tableau CRM to CRM Analytics did not change the underlying product. Salesforce used the change to clarify that CRM Analytics is separate from Tableau, the enterprise BI product Salesforce acquired in 2019 for $15.7 billion. No data migration occurred across any rename, and Wave-era datasets and dashboards carried forward intact.
CRM Analytics datasets can hold up to 10 billion rows with CRM Analytics Plus and return up to 25,000 rows per query by default, which improves on native report limits. It inherits Salesforce’s CRM record-level security model, which is difficult to reproduce in a generic BI tool. Tableau is licensed separately, connects to many systems outside Salesforce, and does not inherit CRM security or record context as cleanly as CRM Analytics.
Many enterprises split responsibilities. The BI team owns Tableau for executive and cross-system dashboards. The Sales Ops team owns CRM Analytics for embedded record-level analytics. Standard Reports & Dashboards remain available for ad-hoc operational queries. For a deeper comparison of CRM Analytics and Tableau, see CRM Analytics vs. Tableau. For the Data 360 versus Snowflake platform decision, see the Data Cloud vs. Snowflake article.
Implementation Order For Salesforce Data Warehouse Reporting
Implementation sequence shapes outcomes as much as architecture choice. Many first projects fail because they skip steps two and five. For the full vendor-neutral blueprint, see the CRM Data Warehouse Architecture guide.
- Audit Volume And History Gaps First. Identify which objects exceed 100,000 records, which fields lack history tracking, and how far back trend analysis needs to reach. This assessment determines whether native reporting remains viable.
- Choose Architecture Based On Use Case. Use an external warehouse for cross-system analytics. Use Data 360 for Agentforce grounding and activation. Use native reports for operational tracking only.
- Capture History Before It Ages Out. Enable field history tracking on close date, amount, stage, and owner immediately. Begin continuous extraction to the warehouse before the three-month native window closes on data you need.
- Connect The BI Layer And Define Metrics Once. Metrics defined in two places will diverge. Establish a single semantic layer such as dbt metrics, Looker LookML, or a CRM Analytics dataset so every dashboard draws from the same definitions of pipeline, ARR, and win rate.
- Apply Row-Level Security At The Warehouse Layer. Keep raw Salesforce objects away from analysts. Expose only modeled marts and enforce the same role hierarchy that governs CRM visibility. This step reduces compliance risk and maintains trust in the data.
Frequently Asked Questions
Does Salesforce Have A Data Warehouse?
Salesforce does not provide a traditional analytical warehouse inside the core CRM. Native Salesforce reports query live CRM data in real time. As covered above, Data 360 operates as a unification and activation layer rather than a warehouse. Organizations that need columnar storage, arbitrary SQL, and full historical retention use an external warehouse such as Snowflake, BigQuery, or Redshift, or a purpose-built solution like Coffee’s built-in data warehouse.
What Are The Four Types Of Reports In Salesforce?
Salesforce offers four native report formats: Tabular, Summary, Matrix, and Joined. Tabular reports list records in rows and columns with no groupings and run fastest. Summary reports group records by a single dimension and support subtotals and charts. Matrix reports group data by both rows and columns for pivot-style analysis. Joined reports combine multiple report blocks in a single view and place the heaviest load on the reporting engine. All four formats share the same platform limits described earlier.
What Is Tableau CRM Called Now?
Salesforce now brands Tableau CRM as CRM Analytics. As noted above, the product has carried four names and has used the CRM Analytics name since April 2022. The rename clarified positioning without requiring any data migration.
Is Tableau Still Relevant In 2026?
Tableau remains a separate enterprise BI product licensed independently from CRM Analytics. It connects to hundreds of data sources outside Salesforce and works well for executive dashboards and cross-system reporting. It does not inherit Salesforce CRM record-level security or record context as cleanly as CRM Analytics, which is why many organizations run both tools.
Why Do Most First Salesforce Warehouse Projects Fail?
Most failures trace back to the historical-data problem. Teams build the ETL pipeline and connect the BI tool, then discover that Salesforce objects store only current state. Stage history, snapshots, deleted records, and ownership changes were never captured. Native historical trending retains only three months of data, field history tracking is limited to 20 fields per object and requires configuration before changes happen, and picklist renames break historical comparisons without generating an error. The fix is to begin continuous extraction and enable field history tracking before the native retention window closes.
Conclusion
The warehouse architecture you choose matters less than the quality of data entering Salesforce. Native reporting hits the hard limits described earlier, and every external warehouse or Data 360 deployment inherits whatever data quality the CRM already has. A carefully designed Snowflake schema built on top of incomplete, manually entered Salesforce data still produces incomplete and unreliable analysis.
Coffee’s Companion App addresses this prerequisite. It deploys as an intelligent agent on top of an existing Salesforce instance and automates data entry, enrichment, and activity logging so the system of record stays accurate without extra effort from reps. Its built-in data warehouse captures pipeline history automatically, and Pipeline Compare surfaces week-over-week changes without spreadsheets or manual exports. Any Salesforce data warehouse reporting architecture, whether external warehouse, Data 360, or native, performs better when accurate data flows in from the start.
Improve Salesforce Data Quality With Coffee