Written by: Doug Camplejohn, CEO & Co-Founder, Coffee | Last updated: September 15, 2026
Key Takeaways
- Pipeline forecasting AI use cases follow a dependency chain that starts with clean CRM data capture and ends with scenario planning. Each step relies on the previous one.
- Accurate deal scoring, close-date prediction, and win probability models require at least 12 months of structured activity data. Without that history, AI outputs collapse to traditional weighted-pipeline guesses.
- Forecast accuracy improves once risk alerts and next-best-action recommendations sit on top of trustworthy deal scores and close dates.
- Common failure modes such as optimistic stage inflation, missing activity logs, and model drift improve with continuous data hygiene more than with model changes.
- Build the data foundation every forecasting use case depends on with Coffee so your revenue team can trust the numbers.
AI Pipeline Forecasting Use Cases In Dependency Order
As of 2026, reviews of AI sales forecasting tools identify at least 15 distinct applications available to revenue teams, including MaxIQ, Clari, Gong Forecast, Aviso, Terret.ai/BoostUp, Salesforce Einstein, HubSpot Sales Hub AI, Forecastio, Outreach Commit, People.ai/Backstory, InsightSquared/Mediafly, Anaplan, Revenue Grid, ZoomInfo Copilot, and Chorus by ZoomInfo. The 12 use cases below represent the subset that forms a practical dependency chain for pipeline forecasting.
- Predictive Deal Scoring
- Deal Win Probability
- Close-Date Prediction
- Slippage And At-Risk Deal Alerts
- Pipeline Health Scoring
- Rep-Level Forecasting
- Scenario Modeling And What-If Analysis
- Forecast Roll-Up And Commit Accuracy
- Next-Best Action Recommendations
- Anomaly Detection
- Renewal And Expansion Forecasting
- Forecast-Vs-Actual Variance Analysis
Predictive Deal Scoring
What it does: Assigns a probability score to each open deal based on historical patterns and real-time engagement signals.
Data prerequisites: CRM stage history, deal amount, close date changes, email reply rates, meeting frequency, stakeholder count, and historical win or loss outcomes all feed the score. The model needs at least 12 months of closed deals and roughly 200 to 300 closed opportunities. Below that threshold, rule-based scoring works better than ML.
Failure mode: When activity data is missing, the model learns historical pipeline gaps rather than current deal reality.
When data is missing: AI forecasting behaves like a fancier version of weighted pipeline.
Deal Win Probability
What it does: Outputs a calibrated close probability per deal, adjusted dynamically as engagement signals change, instead of relying on static stage-based percentages.
Data prerequisites: Historical win or loss outcomes by segment, deal size, and rep, plus email response latency, stakeholder breadth, and competitive mentions in call transcripts.
Implementation note: Mature deployments reach roughly plus or minus 3 to 5 percent variance from actual revenue, compared with plus or minus 12 to 15 percent for traditional rep-submitted forecasts.
When data is missing: Win probability collapses to a stage-weighted guess that matches a spreadsheet calculation.
Close-Date Prediction
What it does: Predicts the most likely close date for each open deal based on deal velocity, stage progression, and buyer engagement patterns instead of rep estimates.
Data prerequisites: Deal velocity by stage, consistent stage definitions, buyer engagement signals such as email response times and meeting cadence, and at least 12 months of historical close-date data.
Implementation note: A reliable close date comes from buyer evidence such as a stated decision timeline or a referenced procurement window, rather than a rep’s quota deadline.
When data is missing: Predicted dates match rep-entered estimates and remove the benefit of the model.
Slippage and At-Risk Deal Alerts
What it does: Flags deals likely to miss their close date or exit the pipeline based on activity recency, stakeholder engagement, and historical slippage patterns.
Data prerequisites: Activity recency logs, stakeholder count, email response rates, at least six months of activity logging, and historical slippage patterns by stage and segment.
Failure mode: Alerts trigger too late to change the outcome when activity logging is incomplete, because the model cannot see engagement drop-off.
When data is missing: The alert system behaves like a lagging indicator and surfaces risk after the quarter is already lost.
Pipeline Health Scoring
What it does: Produces an aggregate score for overall pipeline quality, including coverage ratio, deal velocity, stage distribution, and data completeness, instead of scoring individual deals.
Data prerequisites: Pipeline coverage ratio, stage-by-stage conversion rates, deal age distribution, and field completion rates across open opportunities.
Implementation note: Required fields such as close date, amount, and stage should reach at least 95 percent completion before pipeline health scores become reliable.
Failure mode: A strong score hides a pipeline full of zombie deals when stale opportunities are not flagged and retired.
When data is missing: The score measures CRM hygiene more than business health.
Rep-Level Forecasting
What it does: Generates individual rep forecasts from deal-level signals instead of rep self-reports, so managers can see systematic over- or under-forecasting patterns.
Data prerequisites: Rep-level historical win rates, deal-level activity data, forecast category submissions, and at least 12 months of closed deals per rep.
When data is missing: Rep-level models fall back to manager judgment and reintroduce optimism bias.
Scenario Modeling and What-If Analysis
What it does: Models alternative revenue outcomes by adjusting pipeline assumptions such as win rate changes, deal slippage, and new pipeline creation against a reliable baseline forecast.
Data prerequisites: A proven baseline forecast, at least 18 months of historical variance data, and reliable deal scores and close dates feeding the baseline.
Implementation note: Scenario planning works as a final layer after the baseline forecast proves reliable.
When data is missing: Scenario outputs follow a garbage-in, garbage-out pattern and produce confident but misleading projections.
Forecast Roll-Up and Commit Accuracy
What it does: Aggregates deal-level scores and close-date predictions into a bottom-up forecast number, replacing manual rep roll-ups with a continuously updated, bias-reduced aggregate.
Data prerequisites: Reliable deal scores, accurate close dates, historical conversion rates, and at least 95 percent field completion on open opportunities.
Failure mode: A confident but wrong aggregate number appears when deal scores or close dates feeding the roll-up lack reliability.
When data is missing: Only 60 to 70 percent of CRM fields are consistently populated across B2B organizations, which directly caps the accuracy of a stage-based forecast.
Next-Best Action Recommendations
What it does: Recommends specific rep actions such as outreach, executive escalation, or demo scheduling based on deal risk signals and historical patterns that moved similar deals forward.
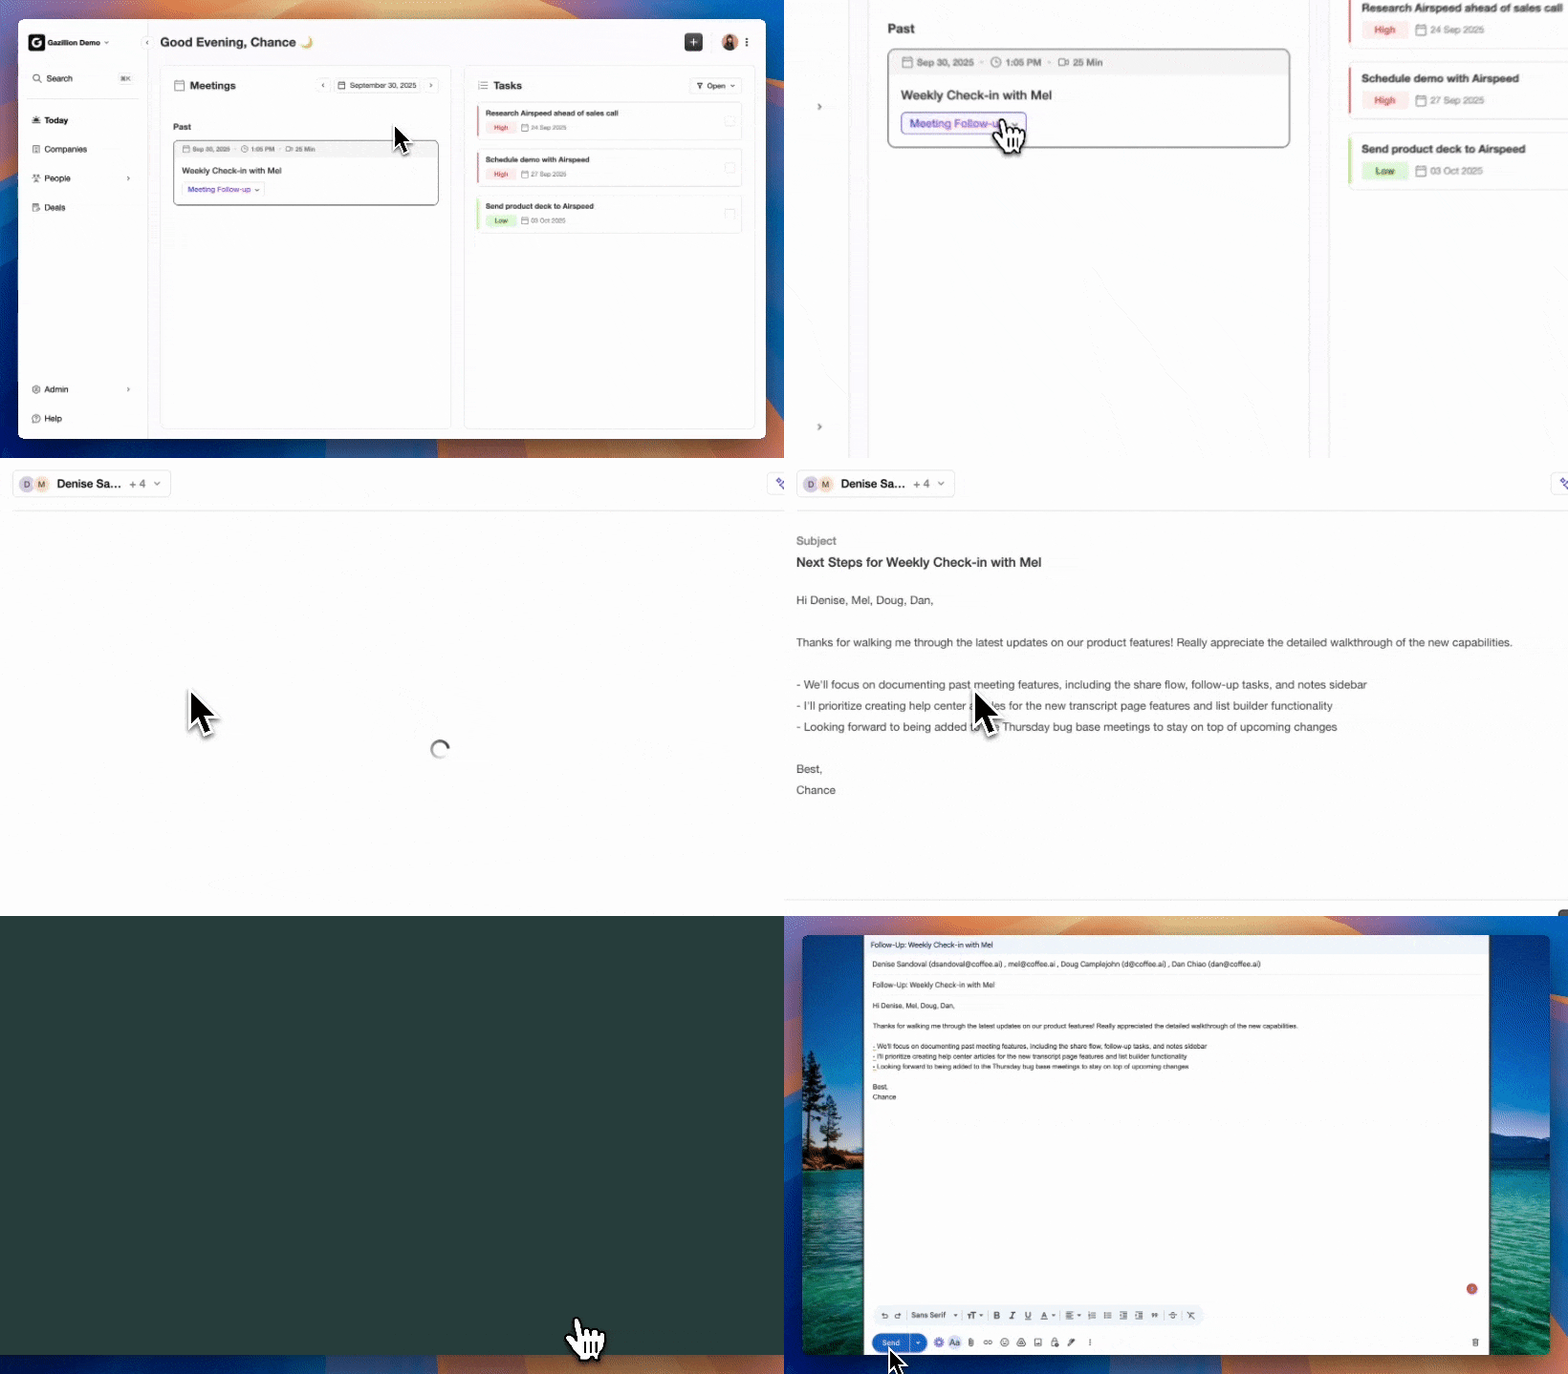
Data prerequisites: Accurate risk alerts, deal-level activity history, call transcripts, and historical action-to-outcome mapping.
Implementation note: Next-best action relies on a working alert layer, because it needs clear risk signals before it can recommend targeted actions.
Failure mode: Recommendations become generic, such as “follow up with the prospect,” when deal-level context is missing and add little value beyond a manual task reminder.
When data is missing: The recommendation engine lacks signal and defaults to noise.
Anomaly Detection
What it does: Identifies deals or pipeline segments that behave outside normal patterns, such as unusual velocity, unexpected stage reversals, or atypical deal sizes, before they surface in a pipeline review.
Data prerequisites: Baseline behavioral norms from at least 12 months of deal history, consistent activity logging, and stage progression data.
Implementation note: Without monitoring, model drift can reduce AI forecasting accuracy by 15 to 20 percentage points over six months without any system alert.
Failure mode: False positives overwhelm managers when baseline norms come from dirty historical data, which causes teams to ignore the alert system.
When data is missing: Anomaly detection lacks a baseline and either flags everything or nothing.
Renewal and Expansion Forecasting
What it does: Predicts renewal likelihood and expansion revenue from existing accounts using product adoption signals, customer health scores, and engagement trends rather than CRM stage alone.
Data prerequisites: Product usage data, customer health scores, support history, stakeholder sentiment, and account engagement trends.
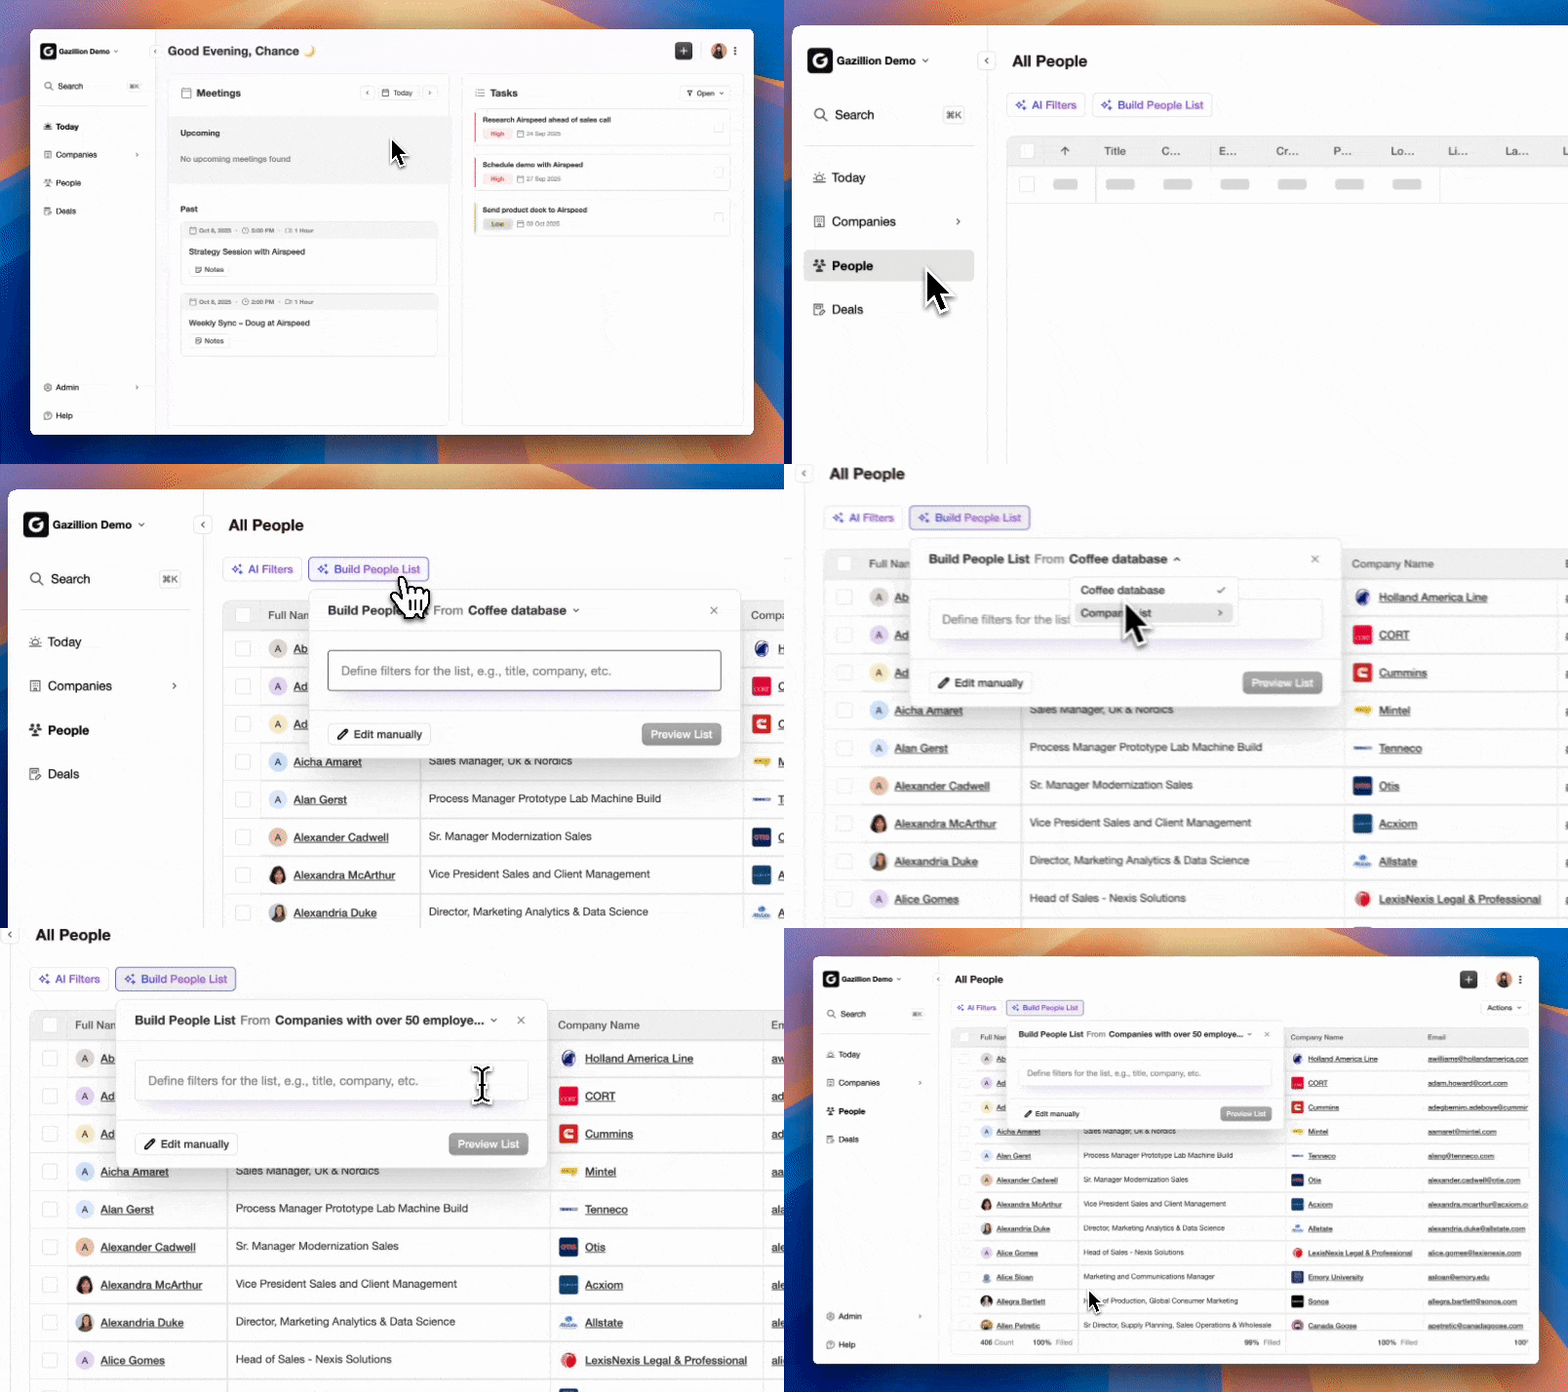
Implementation note: Expansion and renewal forecasts depend more on customer signals such as product adoption, account engagement, and usage trends than on classic opportunity stages.
Failure mode: Forecasting renewals from stage probability alone misses churn risk, budget cuts, or product adoption issues that live outside the CRM.
When data is missing: Renewal forecasts fall back to contract-date-based assumptions and miss behavioral signals that predict churn weeks earlier.
Forecast-vs-Actual Variance Analysis
What it does: Compares committed forecasts against closed-won actuals at the rep, segment, and company level to identify systematic bias and improve future model calibration.
Data prerequisites: Historical forecast snapshots, closed-won records with accurate close dates, and rep-level submission history.
Implementation note: Teams should capture forecast snapshots weekly to track forecast evolution and enable historical forecast-versus-actual reporting.
Failure mode: Without pipeline snapshots, close date slip and forecast category movement disappear whenever a field is overwritten, which makes it impossible to separate real trend from last-minute cleanup.
When data is missing: Variance analysis produces a single aggregate miss number with no diagnostic value.
Build your forecasting data foundation with Coffee and support every use case above.
The Dependency Chain: Implementation Order For Pipeline Forecasting AI
The use cases above connect into a single dependency chain. Each one depends on the output of the use case before it.
Clean CRM data capture → predictive deal scoring → close-date prediction → forecast roll-up → risk alerts → next-best action → scenario planning
The dependencies are structural and shape the rollout plan:
- Deal scoring requires clean CRM data and activity logging.
- Reliable close-date prediction depends on trustworthy deal scoring.
- Forecast roll-up accuracy depends on reliable close dates and deal scores.
- Risk alerts need accurate close dates to flag slippage before it happens.
- Next-best action needs risk alerts to know what to recommend and when.
- Scenario planning needs a proven baseline forecast.
The prioritized implementation order follows directly from these dependencies:
- Fix data capture first
- Then deal scoring
- Then close-date prediction and forecast roll-up
- Then alerts and next-best action
- Finally, scenario planning
The table below adds typical timelines and prerequisites to that sequence so teams can plan resourcing for each phase.
| Phase | Use Case | Prerequisite | Typical Timeline |
|---|---|---|---|
| 1 | Clean CRM data capture | Activity logging, stage standardization | Weeks 1–4 |
| 2 | Predictive deal scoring | 12+ months closed deals, activity data | Weeks 5–8 |
| 3 | Close-date prediction | Trustworthy deal scores | Weeks 9–12 |
| 4 | Forecast roll-up | Reliable close dates | Weeks 13–16 |
| 5 | Risk alerts and next-best action | Accurate baseline forecast | Weeks 17–20 |
| 6 | Scenario planning | Proven forecast accuracy | Weeks 21+ |
Use Case To Data Requirement: A Reference Table
The dependency chain above translates into concrete data requirements. The table below maps each use case to its primary inputs, the minimum history needed, and the failure mode when that data is absent.
| Use Case | Primary Data Inputs | Minimum History | Failure Mode Without Data |
|---|---|---|---|
| Predictive deal scoring | Stage history, activity signals, win or loss outcomes | 12+ months, 200+ closed deals | Model learns historical gaps instead of current reality |
| Close-date prediction | Deal velocity, stage progression, buyer engagement | 12+ months, consistent stage definitions | Dates cluster at quarter-end instead of buyer timelines |
| Slippage alerts | Activity recency, stakeholder count, email response rates | 6+ months activity logging | Alerts trigger too late to intervene |
| Forecast roll-up | Deal scores, close dates, historical conversion rates | 12+ months, 95% field completion | Confident but wrong aggregate number |
| Scenario planning | Reliable baseline forecast, historical variance | 18+ months, proven accuracy | Garbage-in produces garbage scenarios |
Drawbacks Of Forecasting Overly Optimistic Sales Growth
The dependency chain and data requirements above describe how forecasting works when the foundation stays solid. When the foundation breaks, AI forecasting does not fix a broken sales process. The documented failure modes span five categories, all rooted in bad data.
Garbage-in data producing confident but wrong forecasts. When reps inflate stages and anchor close dates to quarter-end, the model learns that pattern and projects it forward. The optimism gets formalized instead of filtered out. Only 47 percent of sales leaders believe their organization’s underlying pipeline data is high quality, so most AI forecasting deployments train on data leaders already distrust.
Overfitting to historical patterns that no longer hold. When demand patterns change structurally, such as a new competitor or a category shift, models trained on pre-shift data become miscalibrated. Without automated monitoring of prediction error metrics and a retraining trigger, accuracy degrades silently.
Black-box distrust from reps and finance. Reps who feel judged by an algorithm quietly ignore it, and a forecast nobody trusts creates more harm than benefit. Trust climbs sharply when teams can see score explanations instead of opaque outputs.
Change management and adoption failure. Change management costs for AI forecasting often exceed technology implementation expenses. The payoff timeline typically extends 12 to 18 months, which runs longer than the 3 to 6 month implementation period many executives expect.
Pipeline inflation from sandbagging or stage inflation. A rep moves a deal to “Proposal” because pricing was discussed on a call, but procurement has not started, the economic buyer has not weighed in, and no timeline exists. The stage suggests late pipeline while the evidence shows early evaluation, which inflates weighted pipeline and contaminates the commit number.
Gartner found only 45 percent of sales leaders have high confidence in forecasting accuracy. AI forecasting amplifies whatever data it receives, so the quality of the underlying pipeline determines whether the output deserves trust.
How Much Does AI Forecasting Cost?
Those failure modes carry a price tag. Cost for AI pipeline forecasting falls across five categories, and vendors rarely present them in isolation.
- Standalone forecasting add-ons: CRM-native add-ons run $20 to $50 per user per month on top of the base CRM subscription. Dedicated revenue-intelligence suites run $80 to $150 per user per month billed annually, with platform minimums that put real entry price at $30,000 to $60,000 per year regardless of seat count.
- CRM platform upgrades: Salesforce Einstein adds $50 per user per month on top of a base CRM subscription that ranges from $25 to $300 per user per month depending on tier.
- Data enrichment subscriptions: Enrichment tools that fill data gaps for forecasting models add a separate line item that increases total cost of ownership.
- Implementation and RevOps labor: Implementation costs add roughly 30 percent to total cost of ownership, including setup fees of $1,000 to $5,000 and training of $2,000 or more.
- Ongoing model maintenance: Monitoring and retraining setup runs $4,000 to $15,000 as a build component, with ongoing costs tied to retraining cadence and drift monitoring.
The build-versus-buy decision requires honest framing. Building in-house demands clean data and ML talent, and internal forecasting systems often exceed $100,000 per year in loaded cost while forcing the company to own the entire data pipeline and model development. Buying point solutions adds another silo and another integration surface. Agent-based approaches that fix data at the source reduce total cost of ownership by removing the data cleanup layer that precedes every other tool.
Choosing Forecasting Models For Pipeline Forecasting
Four model families apply to revenue forecasting, and each fits a different problem shape.
- Qualitative: Expert judgment, Delphi method, and rep surveys. These models work best for new products or markets with no historical data and carry systematic bias.
- Time-series: ARIMA, exponential smoothing, and Prophet. These models work best for aggregate revenue with clear seasonality. They break down in enterprise sales with small deal counts and lumpy quarters, where a single large deal closing or slipping makes the signal meaningless.
- Causal or regression: Linear regression and econometric models. These models work best for scenario planning and driver-based analysis when measurable business drivers maintain a stable relationship to the forecast outcome.
- Machine learning or ensemble: XGBoost, LightGBM, and neural networks. These models work best for deal-level prediction. Ensemble methods combine many weaker models into one stronger prediction and currently dominate accuracy leaderboards in practitioner benchmarks.
For pipeline forecasting specifically, ML and ensemble models handle multi-variable deal data such as engagement patterns, email response times, meeting cadence, and stakeholder count, as long as inputs remain clean. Simpler models like logistic regression outperform complex ensembles when data volume stays low or when a sales leader needs a clear explanation for why a deal appears at risk.
AI Pipeline Forecasting vs. Demand Forecasting: Key Differences
Sales pipeline forecasting predicts deal outcomes from CRM opportunities, historical conversion data, and deal progression patterns. Demand forecasting predicts product demand for inventory and supply chain planning. Both use time-series and ML approaches, but they differ in inputs, granularity, and business application. Pipeline forecasting operates at the deal level, while demand forecasting operates at the SKU or product level. This article focuses on sales pipeline forecasting.
Why Coffee Is the Foundation for Pipeline Forecasting AI Use Cases
Every use case in the dependency chain depends on strong data. The root cause of pipeline forecasting failure usually sits in the data feeding the model. Coffee is the CRM Agent that autonomously captures, enriches, and unifies structured and unstructured data from email, calendar, and call transcripts so the pipeline forecasting AI use cases above actually work.
Coffee’s capabilities map directly onto the data prerequisites each use case requires.
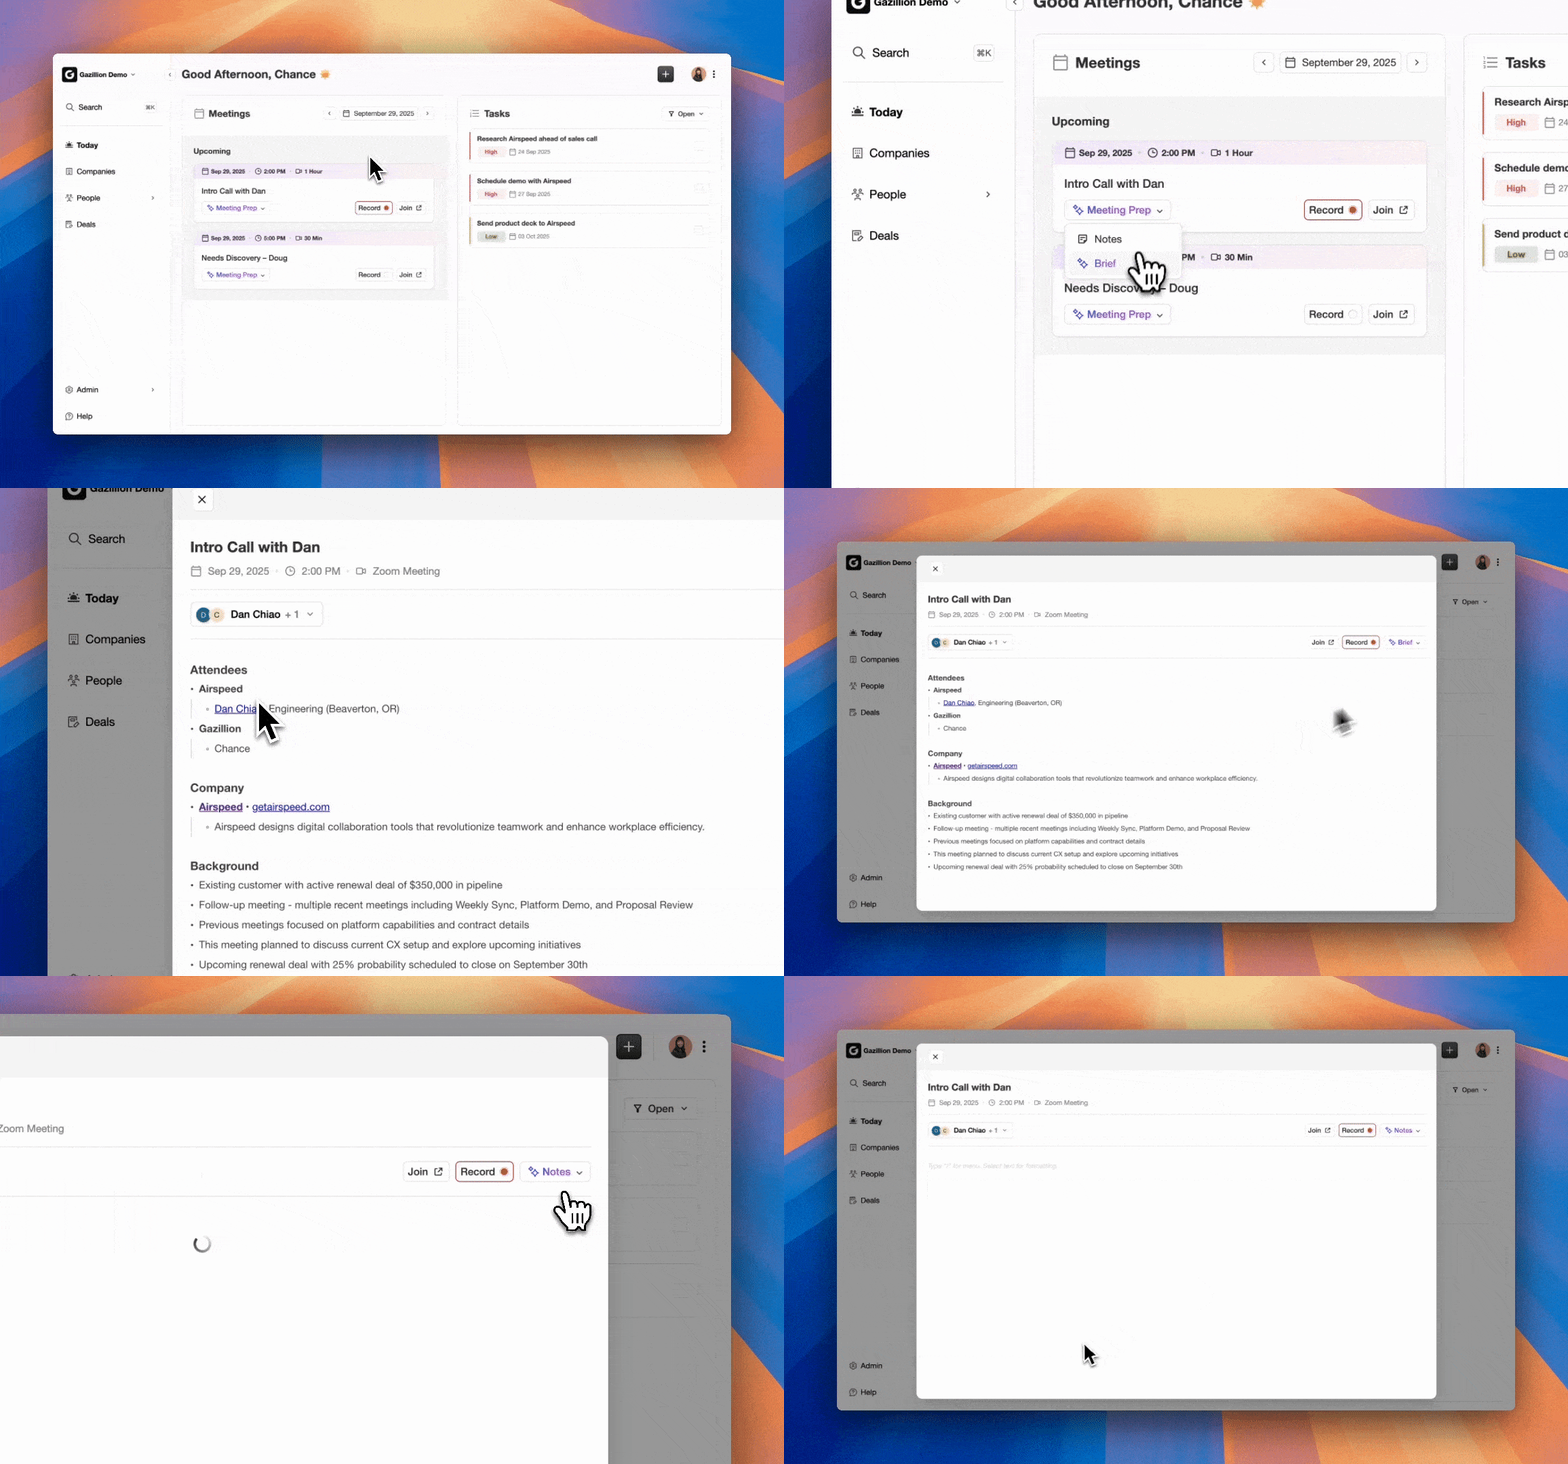
- Automatic data entry and enrichment: Coffee auto-creates contacts and companies from email and calendar activity, enriches records with job titles, funding, and LinkedIn profiles, and associates every interaction with the right deal record without rep involvement.
- Activity logging: Coffee logs last activity and next activity autonomously, keeps deal state current, and provides the engagement signals that predictive deal scoring and slippage alerts require.
- AI meeting summaries: After calls, Coffee generates summaries, identifies next steps, and structures notes according to BANT, MEDDIC, or SPICED, which feeds consistent qualification data into the CRM for close-date prediction and win probability models.
- Pipeline Compare: Coffee visualizes week-over-week pipeline changes, highlights progressed deals, stalled opportunities, and new additions, and turns pipeline reviews into strategic discussions without spreadsheets.
- Pipeline intelligence: Coffee captures history in a built-in data warehouse, so outputting insights becomes seamless and the data foundation stays maintained continuously instead of cleaned only before a model deployment.
Coffee works as a standalone AI-first CRM for small teams or as a Companion App on top of Salesforce or HubSpot, so revenue teams can deploy the agent regardless of their current stack. Coffee is SOC 2 Type 2 and GDPR compliant and does not train public models on customer data.
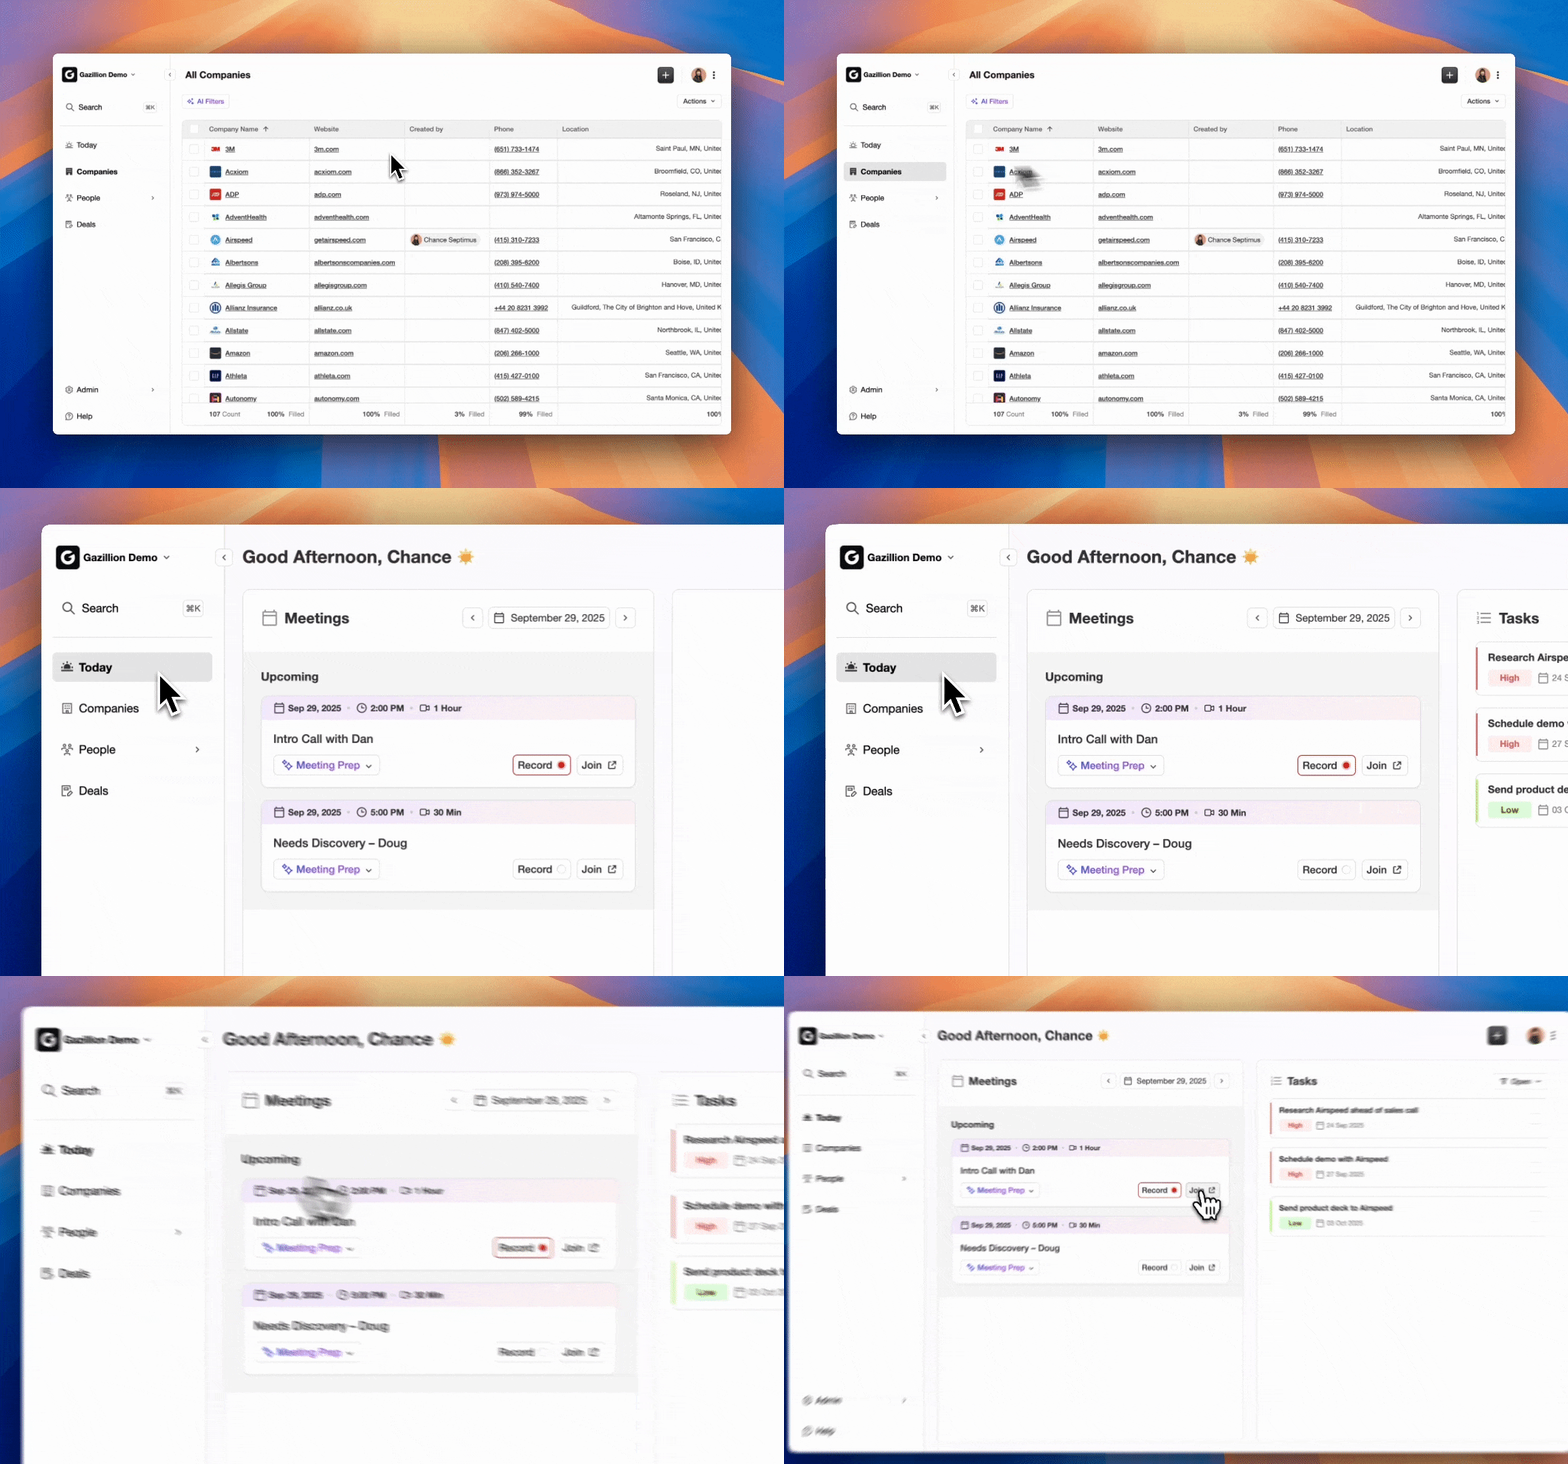
See how Coffee keeps your pipeline data clean and give your pipeline forecasting AI the foundation it needs.
Frequently Asked Questions
How Long Does It Take to Set Up AI Pipeline Forecasting?
Most teams can start using AI forecasts within 2 to 4 weeks of deployment, with accuracy improving over 2 to 3 quarters as the model learns organizational patterns. The data foundation must exist first. Teams with dirty CRM data should expect a CRM data cleanup engagement to run 4 to 8 weeks, typically costing $15,000 to $60,000, before model deployment produces reliable output. The six-phase AI implementation timeline spans roughly 21 or more weeks. The phases are discovery, data assessment, model development, integration, testing, and change management. This reflects a realistic path for teams starting from a typical CRM state. A faster 14 to 18 week schedule appears only when teams already have clean data and a pre-built AI platform.
Who Owns Pipeline Forecasting AI in a 20–200 Person Company?
RevOps typically owns implementation and ongoing maintenance, and the Head of Sales serves as the primary consumer of forecast outputs. In smaller companies without dedicated RevOps, the sales leader or a sales operations analyst manages the system. The CFO acts as a secondary stakeholder who consumes aggregate forecast outputs for budgeting and hiring decisions. Ownership of data quality, which underpins every use case, belongs to whoever manages CRM hygiene, usually RevOps or the Head of Sales in 20 to 200 person companies.