Key Takeaways
- Sales velocity uses this formula: (Number of Opportunities × Win Rate × Average Deal Size) / Sales Cycle Length. It measures how fast your pipeline generates revenue.
- Custom Salesforce reports and dashboards with formula fields help you track velocity trends and pinpoint bottlenecks by stage.
- Strong B2B SaaS teams often reach daily velocity in the $8K-plus range and work to reduce stalled deals and 34% slippage rates.
- Improve velocity by simplifying sales stages, automating follow-ups with Flows, and strengthening data quality.
- Boost your Salesforce opportunity velocity with Coffee’s AI automation, and get started today to double pipeline speed with minimal manual effort.
Why Salesforce Opportunity Velocity Matters for RevOps and Sales Leaders
Opportunity velocity acts as a diagnostic tool that highlights pipeline bottlenecks, clarifies sales stages, and supports quota attainment. RevOps managers and sales leaders use velocity metrics to see where deals stall and which actions create the strongest lift in revenue growth.
The stakes are high. Salesforce reps spend only 28% of their time actually selling, with the rest lost to administrative work. Many teams also face low CRM adoption, fragmented tools, and inaccurate pipeline data that weaken velocity calculations. Understanding the precise formula behind velocity calculations creates a foundation for fixing these data issues and building reliable metrics.
Salesforce Sales Velocity Formula and Core Components
The standard sales velocity formula multiplies the number of deals by average deal size and win rate, then divides by average sales cycle length. Each component directly shapes how quickly your pipeline turns into revenue.
| Component | Description | SaaS Benchmark |
|---|---|---|
| # Opportunities | Active pipeline deals | Varies by segment |
| Win Rate | Closed-won percentage | 25% |
| Avg Deal Size | Closed-won mean value | $26,265 (median ACV for private SaaS) |
| Cycle Length | Create-to-close days | 84 days (median B2B SaaS) |
Consider a SaaS company with 50 opportunities, the median deal size shown above, a 25% win rate, and an 84-day sales cycle. That pipeline generates about $3,910 per day in velocity. Consistent measurement across clear time periods, along with segmentation by product, geography, or customer type, turns this number into actionable insight.
Building Salesforce Pipeline Velocity Reports and Dashboards
Effective velocity reporting in Salesforce depends on admin access and clean opportunity data. Use this step-by-step approach.
1. Create a Formula Field: Go to Setup > Object Manager > Opportunity > Fields & Relationships. Create a custom formula field called “Velocity_Daily” with this formula: (Amount * Probability) / Days_in_Stage__c.
2. Build the Report Type: Open Reports > New Report > Opportunities. Filter for open opportunities and add columns for Opportunity Name, Stage, Amount, Probability, Days in Stage, and your Velocity formula field.
3. Configure Dashboard Widgets: Add dashboard components that show total velocity, week-over-week changes, and velocity by sales stage. Use summary formulas to calculate team-wide metrics.
4. Track Historical Trends: Schedule reports that capture weekly velocity snapshots so you can analyze trends and spot bottlenecks over time.
Common mistakes include excluding closed-lost opportunities from historical views and skipping segmentation by deal characteristics. You can automate these reports with minimal effort. Get started with Coffee for hands-free pipeline intelligence.
Defining Good Sales Velocity and Finding Bottlenecks
Industry benchmarks give useful context for your velocity performance. B2B SaaS companies often reach a daily velocity in the $8K-plus range mentioned earlier. SaaS startups can target $1,000 to $2,000 in daily velocity per sales rep.
Typical bottlenecks include deals stuck in specific stages, weak win rate progression, and manual data gaps that block accurate tracking. Deal slippage rates average 34% across the industry, while top performers keep that number lower. You can troubleshoot by reviewing stage-level duration and spotting stages where opportunities consistently stall.
Proven Salesforce Tactics to Improve Opportunity Velocity
Meaningful velocity gains come from focused improvements across all four parts of the formula.
1. Refine and Simplify Sales Stages: Use Einstein Opportunity Scoring to predict close probability and flag at-risk deals early. Tighten stage exit criteria and remove approval steps that do not add value.
2. Automate Follow-ups for Stalled Deals: Use Salesforce Flow Builder to create automated sequences for opportunities that slow down. Configure Deal Stale Alert Flows to notify reps when an opportunity has no activity for more than 14 days.
3. Improve Data Quality and Consistency: Add lead scoring and data validation rules so opportunity records stay accurate. Strong data quality supports reliable velocity calculations and better forecasting.
Manual processes eventually cap your gains. AI agents now provide the next stage of velocity improvement by handling repetitive work at scale.
How Coffee’s Salesforce Companion App Doubles Opportunity Velocity
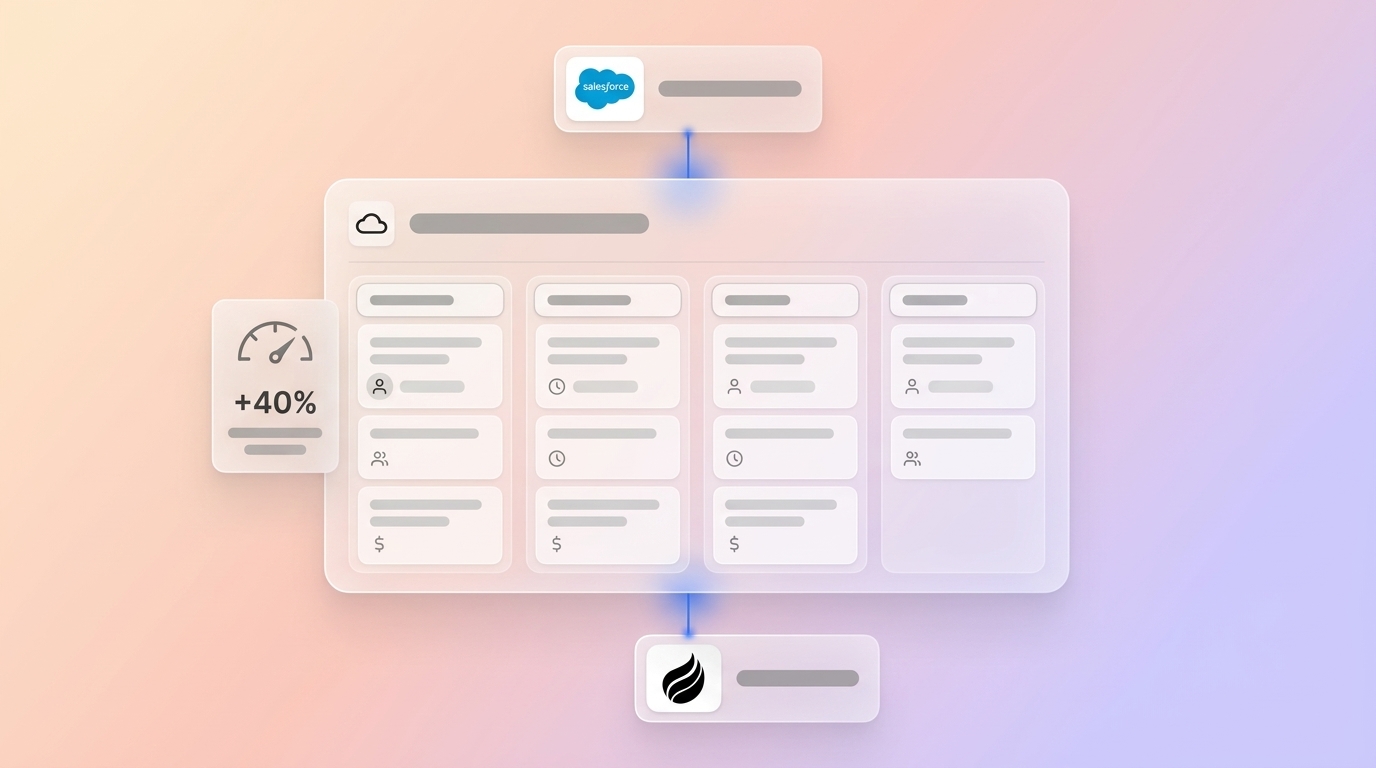
Coffee acts as a tireless AI agent that runs on top of your existing Salesforce instance and handles data entry and intelligence work. Traditional CRM systems wait for reps to update records, while Coffee actively captures, enriches, and analyzes opportunity data.
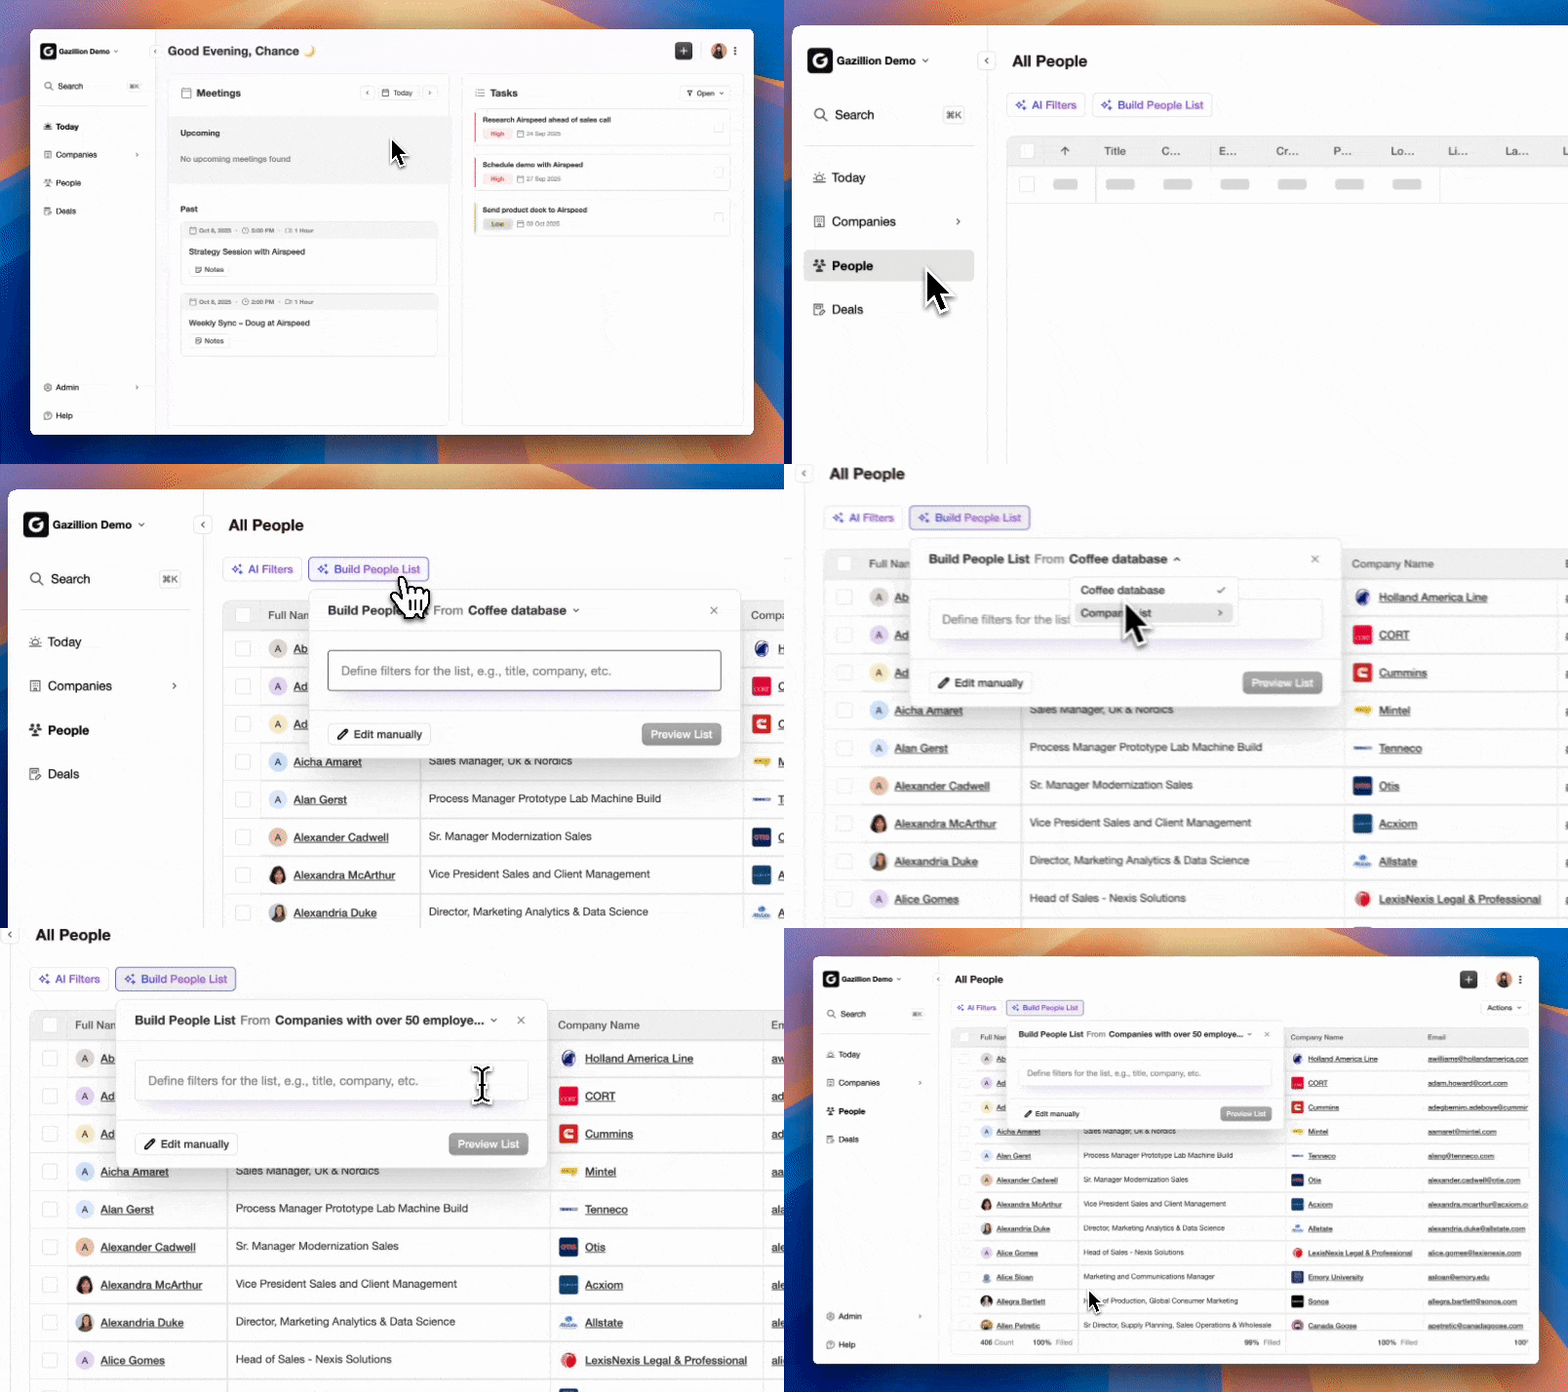
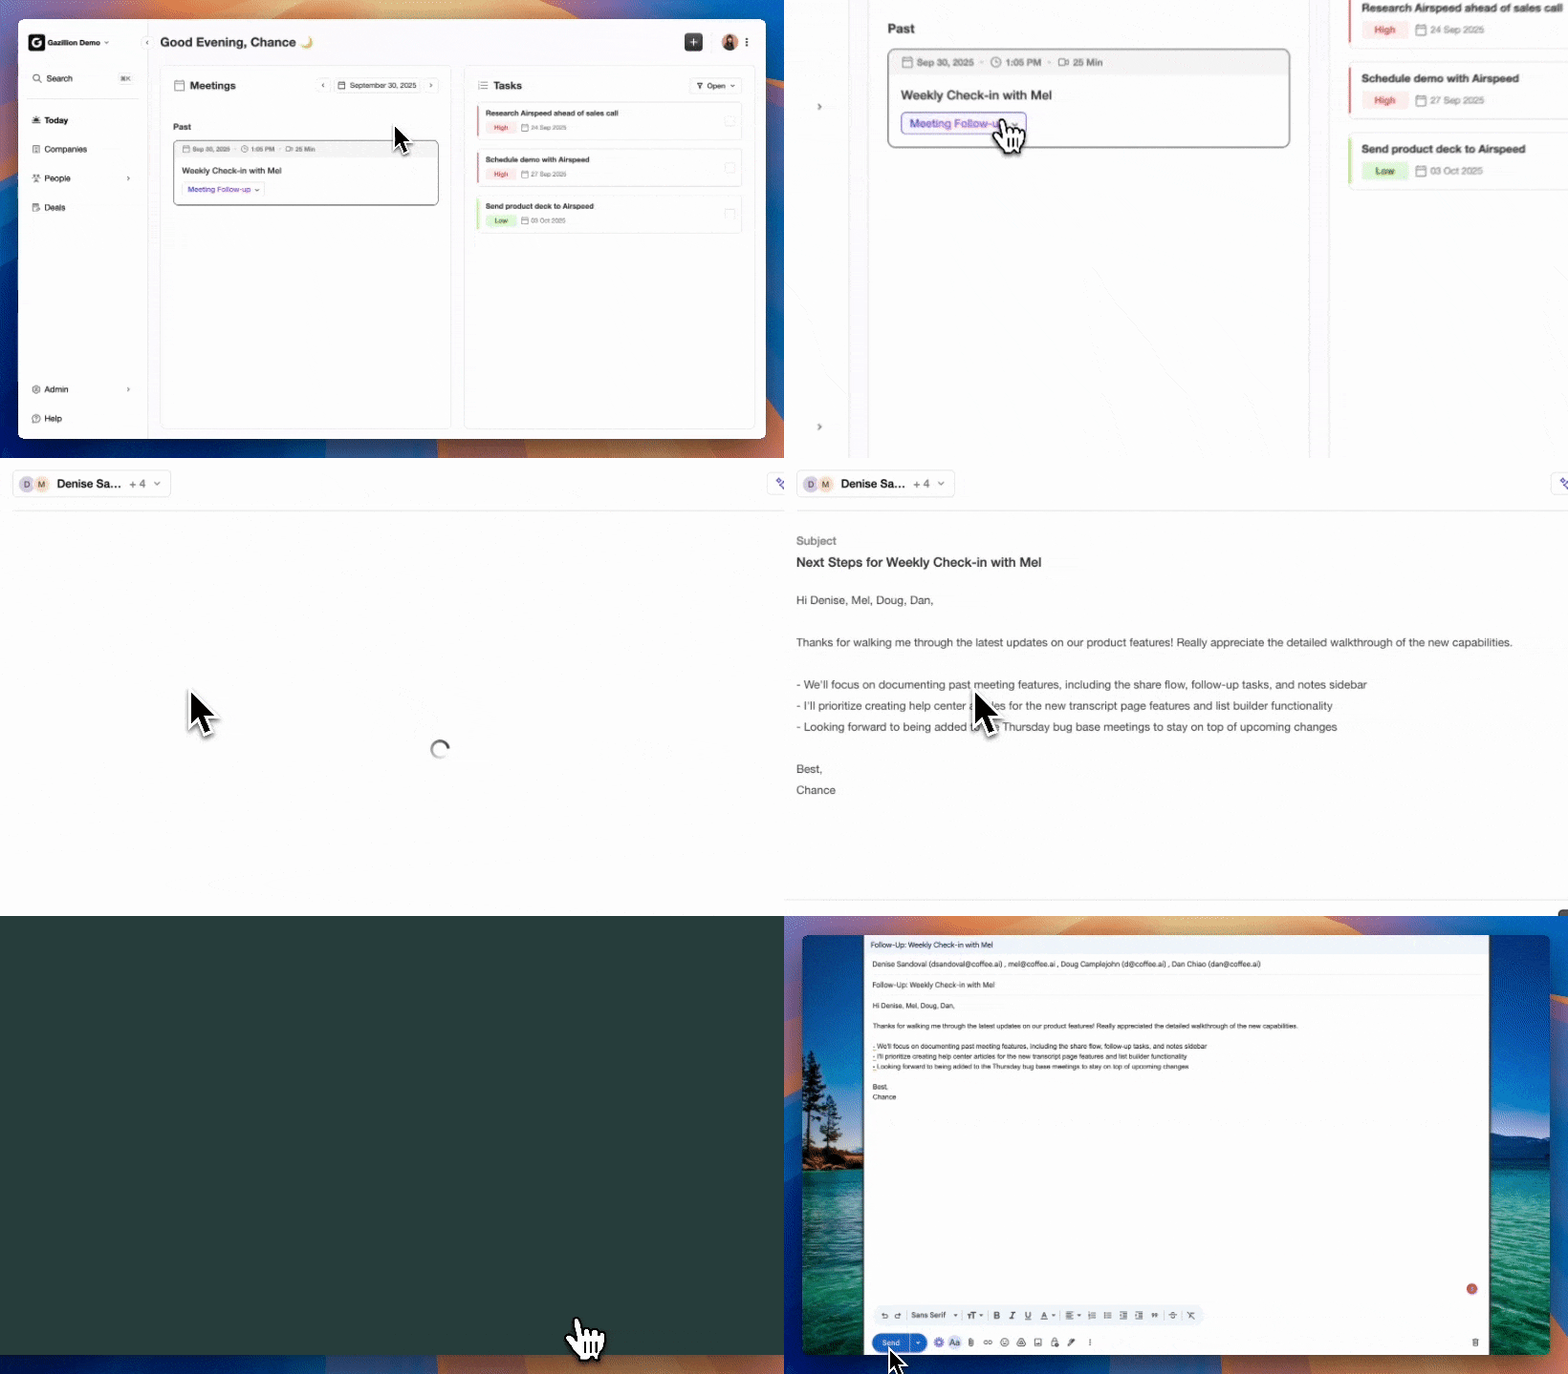
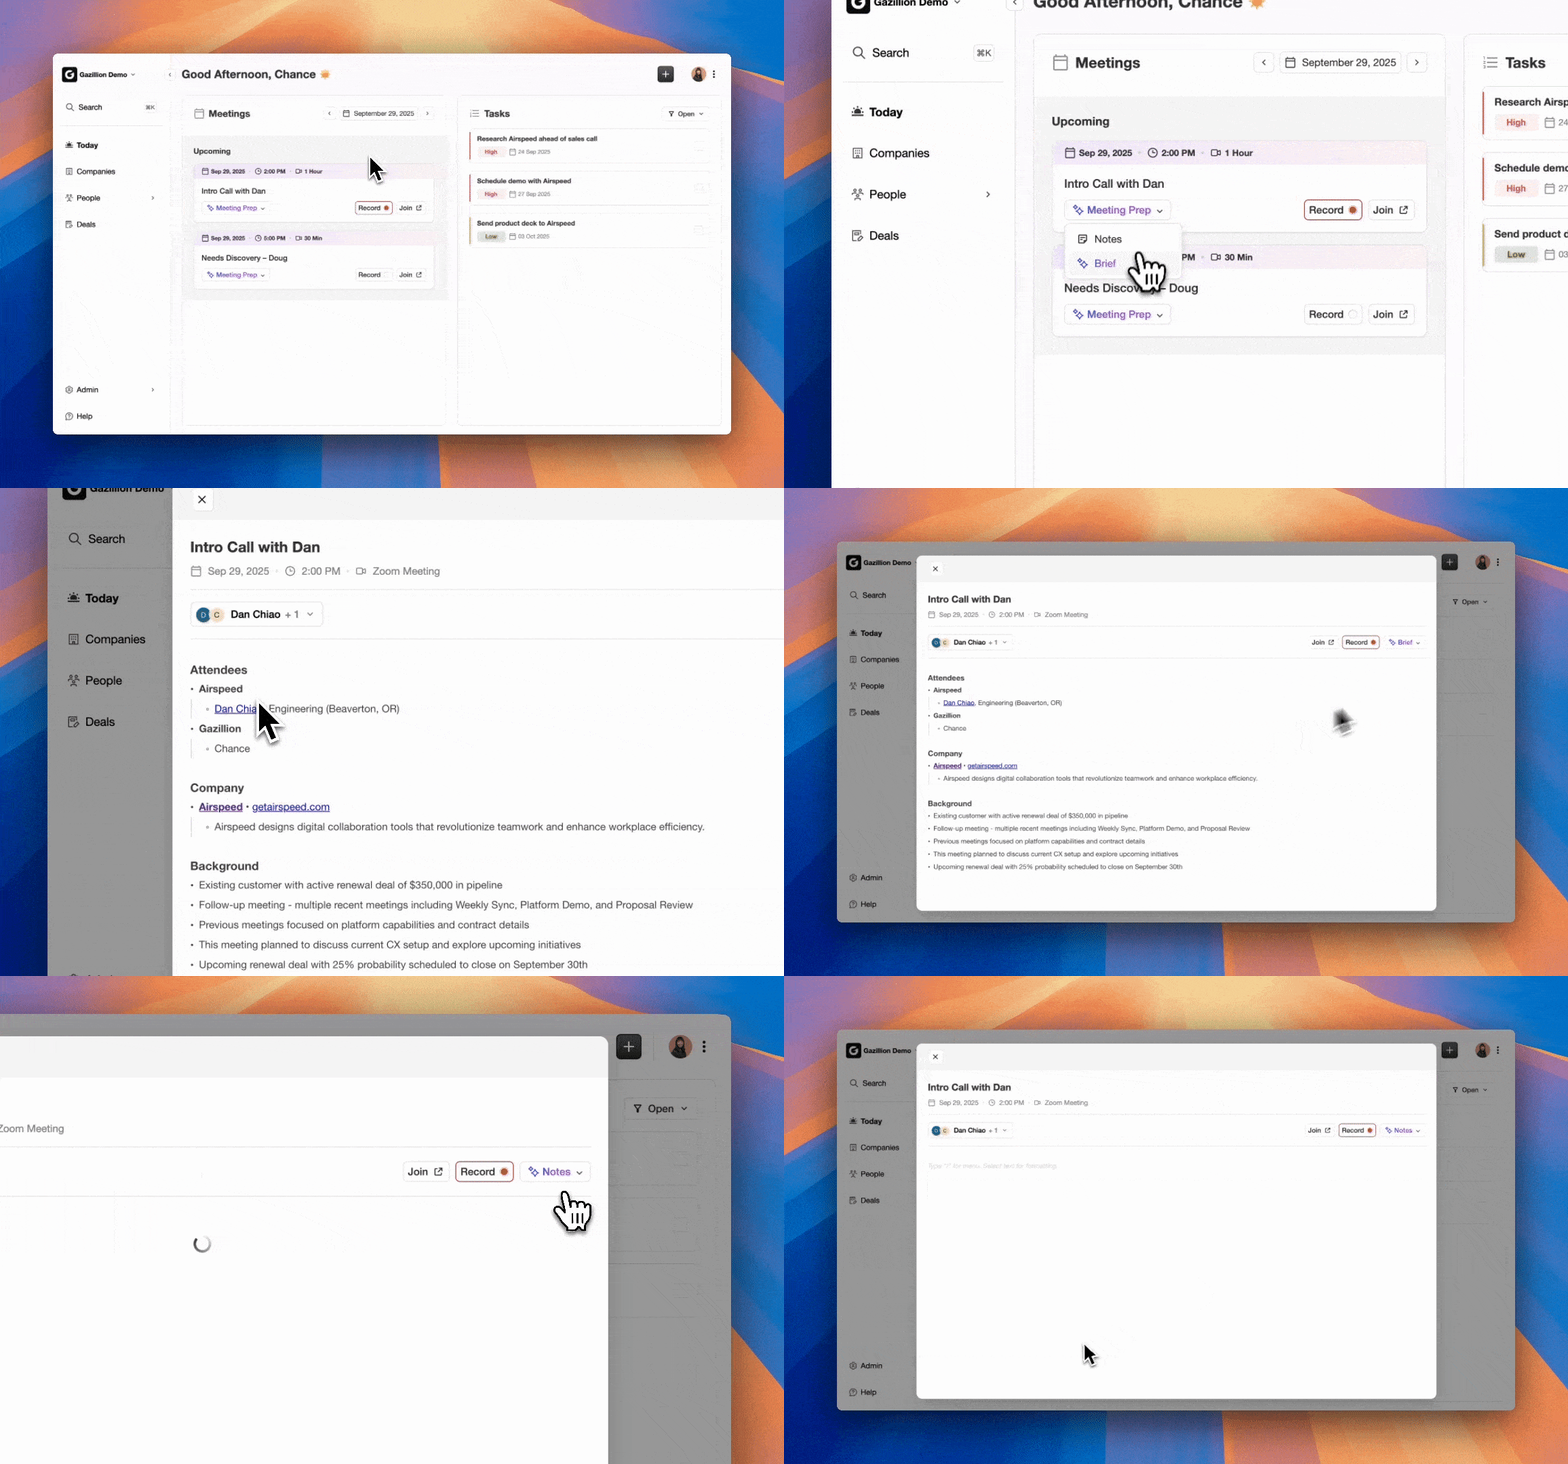
The Coffee Agent manages key tasks that affect velocity, including automatic contact and company creation from email interactions and real-time activity logging. It also offers Pipeline Compare features that visualize week-over-week deal progression. These capabilities remove the manual data entry burden that eats into selling time.

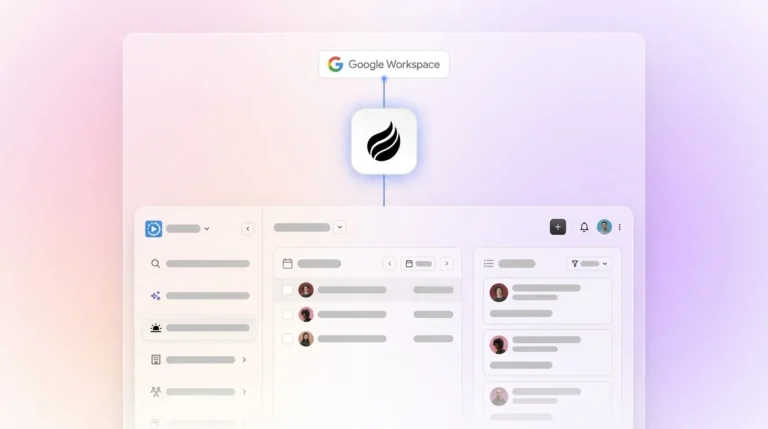
Coffee’s implementation playbook stays simple. You authenticate Google Workspace or Microsoft 365, sync existing opportunities, and let the agent start gathering intelligence. Coffee stands out by processing unstructured data from emails and call transcripts, maintaining SOC 2 Type 2 compliance, and integrating directly with Salesforce.
ROI metrics show Coffee’s impact on velocity. Reps save 8 to 12 hours each week on administrative tasks, and AI automation can reduce sales cycles by 30%. One firm with more than $10M in revenue removed manual pipeline management, replaced spreadsheet-based reviews with automated insights, and doubled opportunity velocity within 90 days.
Scaling Coffee, Measuring Impact, and Defining Success
Teams validate velocity improvements by tracking dashboard metrics and uplift over time. Useful views include week-over-week velocity changes, stage progression rates, and reductions in deal slippage.
Once a playbook works for one group, you can roll out the same automation across additional sales teams. You can also connect these workflows with Einstein Analytics for deeper forecasting and scenario planning.
Clear success criteria include steady velocity increases, lower manual reporting time, and more accurate forecasts that leadership can trust.
FAQ
What is velocity in Salesforce?
Velocity in Salesforce measures how quickly your sales pipeline generates revenue. The calculation uses this formula: (Number of Opportunities × Win Rate × Average Deal Size) / Sales Cycle Length. Velocity appears as dollars per day and helps you find bottlenecks, refine stages, and predict revenue timing. Higher velocity reflects faster deal movement and more efficient pipeline management.
Does Salesforce have an opportunity velocity calculator?
Salesforce’s Revenue Intelligence Platform for Sales Cloud includes Forecast Insights that track trends in sales velocity. You can also create custom formula fields and reports that follow the standard velocity formula. Coffee automates these calculations and delivers real-time velocity tracking with Pipeline Compare features, which removes spreadsheet work and gives instant visibility into deal progression and pipeline health.
What defines high velocity sales in Salesforce?
High velocity sales in Salesforce usually involve sales cycles under 30 days, win rates above 25%, and steady deal progression without long stalls. These outcomes depend on automated data capture, AI-powered lead scoring, streamlined approvals, and early detection of bottlenecks. Coffee’s AI agent supports high velocity by taking over manual tasks and supplying real-time pipeline intelligence.
Conclusion: Accelerate Your Salesforce Pipeline Today
Stronger Salesforce opportunity velocity starts with consistent measurement, clear bottleneck analysis, and targeted process automation. The formula gives you a baseline, and AI-powered automation then sustains gains by removing manual data entry and surfacing real-time insights.
Coffee turns manual pipeline work into automated revenue acceleration and operates as a dedicated AI agent on top of Salesforce. You can transform your opportunity velocity starting now. Get started with Coffee and aim for 2x pipeline speed without adding extra operational overhead.