
Written by: Doug Camplejohn, CEO & Co-Founder, Coffee
Key Takeaways for Fixing Lead Scoring
-
Most lead scoring issues start with poor CRM data quality, not flawed models. Dirty fields make even smart scoring logic unreliable.
-
Bad data produces random scores, misroutes high-intent leads, and hides real revenue opportunities from your sales team.
-
Typical problems include missing firmographics, stale activity dates, inconsistent fields, and no negative scoring rules to filter out bad fits.
-
A structured 7-step framework, from separating fit and intent signals through automation, creates consistent and trustworthy scores.
-
Teams that want to automate CRM data quality and lead scoring accuracy should explore Coffee’s autonomous data entry capabilities.
Quick Diagnostic Checklist: How Bad Data Breaks Your Scores
Use this checklist before changing any scoring rule. Each item maps directly to a specific scoring failure mode.
-
Missing firmographics (industry, employee count, revenue): Fit scores default to zero or a median value, so every lead looks equally qualified. A defensible mid-market B2B scoring model assigns 35% weight to firmographics alone, and missing fields collapse that entire dimension.
-
Stale activity dates: B2B contact data decays at 2.1% per month, compounding to roughly 22.5% annually. Old last-touch dates inflate intent scores for leads that have already gone cold.
-
Inconsistent qualification fields: When “Company Size” contains both “51–200” and “100” in the same field, rule-based scoring cannot match either value reliably. Identical leads then receive different scores.
-
No separation of fit and intent properties: Collapsing fit and intent into a single score hides which lever is broken. High-fit, low-intent and low-fit, high-intent accounts end up in the same sales motion.
-
Absent negative scoring rules: Without deductions for personal email addresses, 90-plus days of inactivity, or competitor domains, score inflation pushes unqualified leads into the SQL queue.
-
Contact-level-only scoring on multi-stakeholder deals: The average B2B buying committee includes 6 to 10 stakeholders. Scoring a single contact ignores distributed engagement across the account.
-
No time-decay logic: Behavioral and intent signals should decay 10–20% every 30 days. Without decay, a demo request from eight months ago still drives a high score today.
-
Model never retrained on closed-won data: Predictive models degrade over time as market conditions change. Quarterly retraining against actual outcomes keeps them calibrated.
If three or more items apply, data quality, not model design, is the primary conversion bottleneck. Coffee automates the data foundation so you can fix these issues before investing further in scoring logic.
Rule-Based vs Predictive Scoring Under Clean and Dirty Data
Before you implement fixes, understand how your current scoring approach reacts to data quality problems. This context shows which steps in the framework will deliver the fastest return.
The table below compares how each scoring approach behaves with clean versus dirty CRM data. All figures are drawn from published research.
|
Scoring Type |
Clean Data Performance |
Dirty Data Performance |
Key Evidence |
|---|---|---|---|
|
Rule-based |
Consistent and auditable, with scores that reflect ICP criteria accurately when fields are populated and standardized |
Silent failures, because missing or inconsistent fields return zero or default scores and produce random rank-ordering with no error signal |
Rule-based approaches rely on predetermined criteria such as job title or company size, and any gap in those fields breaks the logic |
|
Predictive / ML |
Amplifies bias, because the model learns dirty patterns and confidently scores the wrong leads as top opportunities, which makes errors harder to detect than in rule-based systems |
Predictive scoring has a higher ceiling and a lower floor. On dirty data, it underperforms even a basic rule-based model because it encodes and amplifies data errors at scale.
7-Step Framework to Improve Lead Scoring Accuracy
Step 1: Separate Fit and Intent Signals
Start by giving fit and intent their own fields so you can see which one needs work. Required fields: Industry, employee count, revenue range, and job title for fit, plus pricing page visits, demo requests, content downloads, and email click recency for intent. Ownership: RevOps defines the field taxonomy, and marketing ops enforces it on all inbound forms. Checkpoint: Confirm your CRM stores fit and intent as distinct properties. HubSpot natively generates separate fit and engagement score properties when a combined score is created, which enables independent analysis of each dimension. Pitfall: Merging both into one numeric field before analysis makes it impossible to see whether a low score reflects poor fit, low intent, or both.
Step 2: Implement Negative Scoring Rules
Use negative scoring to keep bad fits out of the SQL queue. Required rules: Deduct points for personal email addresses (−10), competitor domains (−20), and 90-plus days of inactivity (−10). Add deductions for student or intern titles and unsubscribe events. These thresholds directly affect which leads sales will see, so Sales and RevOps should define them together to stay aligned. When you implement these rules, apply them as pure subtraction outside the positive total instead of reducing fit points, because that separation preserves the integrity of your fit scoring dimension. The most common mistake is treating negative scoring as optional, which allows score inflation to keep populating the SQL queue with unqualified leads.
Step 3: Add Time-Decay Logic
Apply time decay so old activity stops propping up scores. Required logic: Apply −10% per 30 days to demo requests and −20% per 30 days to third-party intent surges, while you keep fit signals stable and recompute monthly. Ownership: Marketing ops configures decay schedules in the scoring engine. Checkpoint: A lead with no activity in 60 days should have its intent score reduced by at least 20% automatically. Pitfall: Applying decay to fit signals such as company size or industry, which are relatively stable and should not decay on the same schedule.
Step 4: Retrain the Model on Closed-Won Patterns
Retrain your model on real wins so it learns what success looks like. Required data: Export all leads from the past year with scores, engagement history, and outcomes, and use a minimum of 200 closed opportunities and 6–12 months of data before ML retraining. Ownership: RevOps runs quarterly retraining, and sales validates the output against recent pipeline. Checkpoint: Test the retrained model against the last 100 closed-won and 100 closed-lost opportunities. If it cannot distinguish between them, adjust scoring criteria before deployment. Pitfall: Retraining on all closed deals instead of filtering to closed-won, which teaches the model that losing patterns are positive.
Step 5: Move to Account-Level Scoring
Score at the account level so buying committees receive accurate priority. Required fields: Aggregate engagement signals across all contacts at an account, and track role diversity such as economic buyer, champion, and technical evaluator, along with content consumption breadth. Ownership: RevOps configures account-object scoring, and sales defines minimum buying-committee coverage thresholds. Checkpoint: A VP requesting one demo should not be outranked by an intern opening ten emails, and account-level aggregation prevents single-contact noise from distorting priority. Pitfall: Counting duplicate contacts at the same account as separate engagement signals, which inflates account scores.
Step 6: Shift from Rules to Predictive/AI Scoring
Introduce predictive scoring once your data foundation is stable. Required inputs: Clean, complete CRM data from Steps 1–5, labeled conversion outcomes, and a minimum AUC of 0.70 as a deployment threshold. Ownership: RevOps or a data analyst trains and monitors the model, and sales reviews score distribution weekly. Checkpoint: As shown in the comparison table above, AI-powered lead scoring models can deliver the 20–40% conversion lift when supported by data quality governance, scheduled retraining, and ongoing performance monitoring. Pitfall: Deploying a predictive model before completing Steps 1–5, which encodes errors at scale and produces confident but wrong outputs.
Step 7: Automate Data Entry and Enrichment
Use automation to keep CRM data accurate without rep effort. Required automation: AI-powered CRM platforms automatically extract information from emails, call transcripts, and documents using natural language processing, then populate the appropriate CRM fields without manual entry. Enrich firmographic fields through integrated data partners, and auto-log all activity dates. Ownership: RevOps deploys and monitors the automation layer, so reps do not handle data entry for standard fields. Checkpoint: CRM accuracy should remain high, because when accuracy is low, forecasts and reports become unreliable and teams waste significant time on bad data. Pitfall: Treating automation as a one-time enrichment run. Data decays continuously, so automation must run on an ongoing basis to sustain scoring accuracy. Sales representatives lose approximately 500 hours per year validating and correcting bad prospect data, and automation in this step gives that time back.

Validate Results with Three Core Metrics
Measure the impact of the 7-step framework with three simple metrics.
SQL-to-opportunity conversion lift. Establish a baseline conversion rate before implementation. High-performing companies that implement lead scoring often achieve higher conversion rates than the industry average. A 20–40% lift in conversion among top-scored leads within 90 days shows that data quality improvements are translating into scoring accuracy.
Reduction in manual score overrides. Track how often sales manually overrides a score each week. A high override rate means the model does not match rep judgment and usually points to data quality gaps. A sustained reduction in overrides over 60 days confirms that the model is earning trust.
Week-over-week pipeline velocity stability. AI-enhanced CRM systems can automatically track pipeline changes and highlight progressed deals, stalled opportunities, and new additions. Stable or improving pipeline velocity, measured weekly, confirms that automated data maintenance keeps scores current and routing improves over time.
Coffee’s automated activity logging and enrichment keeps these metrics moving in the right direction without manual intervention.
How the 7-Step Process Scales for Small and Large Teams
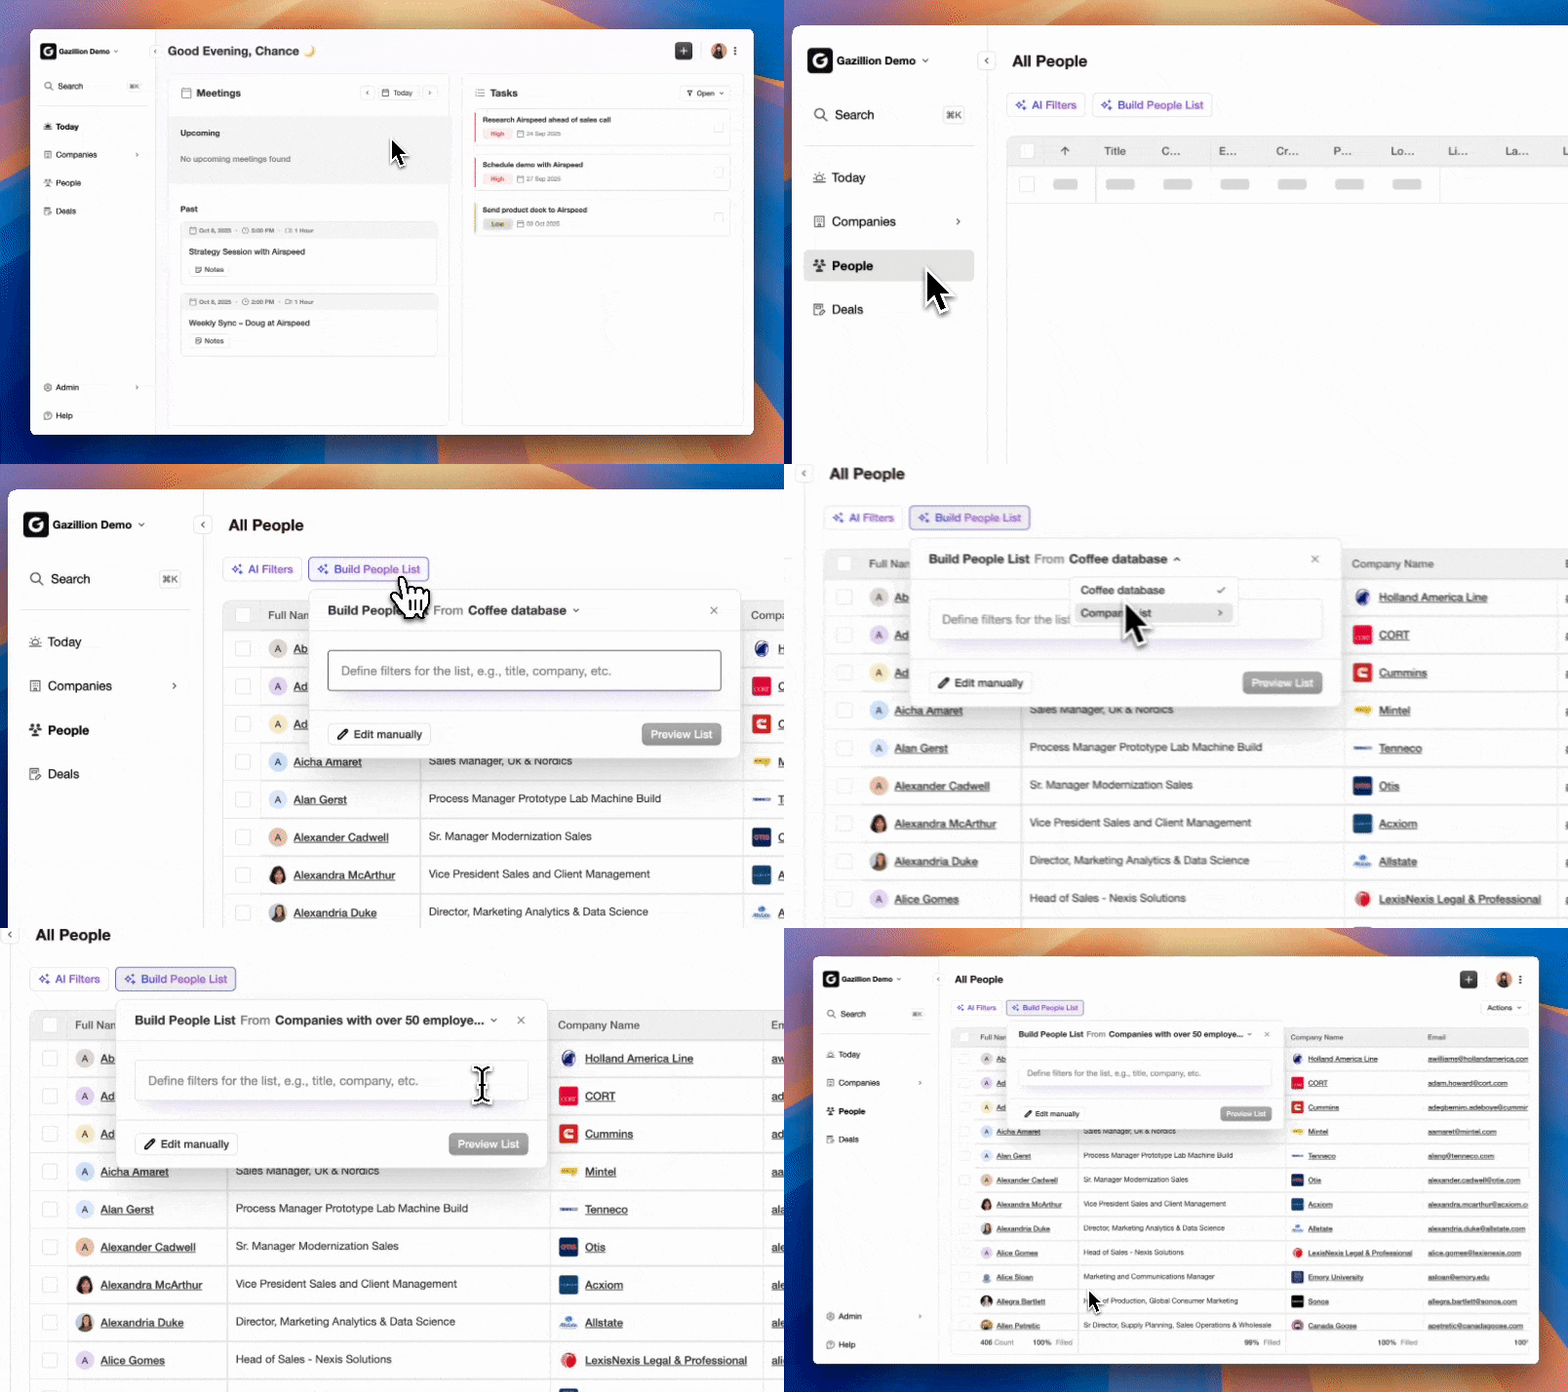
Teams of 5 (spreadsheet or early-stage CRM users): Start with Steps 1–3. Define fit and intent fields in a shared schema before migrating to any CRM. Use a lightweight standalone CRM with an autonomous data-entry agent so the schema stays clean from day one without manual upkeep. Skip predictive scoring (Step 6) until you meet the 200-opportunity threshold described in Step 4. Focus validation on override rate and conversion lift from the top 20% of scored leads.
Teams of 20–50 (Salesforce or HubSpot-committed): Apply all 7 steps. Deploy a companion automation layer on top of the existing CRM instance to handle data entry, enrichment, and activity logging without replacing the system of record. Many B2B SaaS companies retrain ML lead scoring models monthly or quarterly, and at this team size a quarterly retraining cadence with weekly MQL-to-SQL conversion reviews by score band is sustainable. Account-level scoring in Step 5 becomes critical at this scale because buying committees are larger and single-contact scoring creates more noise.
Frequently Asked Questions
Timeline for Seeing Measurable Scoring Improvements
Most teams see fewer manual score overrides within 30 days of implementing automated data entry and enrichment, because reps stop correcting fields that automation now populates correctly. SQL-to-opportunity conversion lift usually becomes visible within 60–90 days, once enough scored leads move through the pipeline to create a reliable sample. Predictive model improvements follow a longer horizon, since quarterly retraining cycles mean the first meaningful accuracy gain appears around 90 days, with compounding improvements at 6 and 12 months as the model accumulates more closed-won signal.
Compatibility with Salesforce and HubSpot
The 7-step framework works inside existing Salesforce or HubSpot instances. Steps 1–6 rely on configuration changes to scoring rules, field taxonomy, and model training, which both platforms support natively. Step 7, automating data entry and enrichment, is where a companion automation layer adds the most value, because it writes clean, enriched data back to the existing CRM without migration. Teams that commit to Salesforce or HubSpot can deploy an autonomous CRM agent as an intelligent layer on top of their current system, which preserves workflows, quotas, and forecasting while removing the manual data entry that degrades scoring accuracy.
Data Security and Compliance in Automated Scoring
Automation in Step 7 should meet strict security and compliance standards. Automated data entry and enrichment tools should be evaluated against SOC 2 Type 2 certification and GDPR compliance as minimum requirements for B2B use cases. Enrichment data sourced from licensed third-party partners, instead of scraped or inferred public data, reduces compliance exposure. For teams in regulated-adjacent industries, confirm that call transcription and email parsing do not store raw content in systems outside your data residency requirements. Any automation layer that writes data back to Salesforce or HubSpot inherits the security posture of those platforms, so authentication should use OAuth with least-privilege scopes instead of admin credentials.
How the Scoring Model Evolves with a Maturing Sales Motion
The scoring model should mature alongside your sales motion. In the first 6 months, rule-based scoring with clean data from Steps 1–5 usually outperforms an undertrained predictive model. Once you reach 200 or more closed opportunities, the model can be retrained on closed-won patterns and predictive scoring in Step 6 begins to add measurable lift. As the team scales past 20 reps and deal complexity grows, account-level scoring and buying-committee tracking become the primary levers. At full maturity, the scoring model shifts from a static configuration to a continuously updated system, where automated data entry keeps inputs current, quarterly retraining keeps the model calibrated, and weekly conversion monitoring by score band surfaces drift before it affects pipeline. Each step builds on the previous one, so you do not need to rebuild the framework at each stage.
Conclusion: Make Lead Scores Durable with Automation
Inaccurate lead scoring starts as a data quality problem before it becomes a model problem. As noted in Step 7, sales representatives lose approximately 500 hours per year to data validation, and no scoring model, rule-based or predictive, produces reliable output when CRM fields are missing, stale, or inconsistent. The 7-step framework addresses this in sequence by separating fit from intent, adding negative scoring and time decay, retraining on closed-won patterns, moving to account-level scoring, shifting to predictive AI, and automating the data entry layer that keeps everything working without ongoing manual effort. The final step acts as the mechanism that makes every preceding improvement durable. Coffee’s autonomous CRM agent improves lead scoring accuracy and maintains it without the manual upkeep that causes most models to degrade.

