Written by: Doug Camplejohn, CEO & Co-Founder, Coffee | Last updated: June 19, 2026
Key Takeaways
- Stale or incomplete CRM data weakens every pipeline metric, drains revenue, and makes forecasts unreliable.
- Pipeline Coverage Ratio, Velocity, Win Rate, Sales Cycle Length, and Stage Conversion Rates only work when opportunity records stay clean and current.
- Red flags such as aging deals, declining velocity, or sudden conversion drops often come from missing activity logs, not poor sales execution.
- Automated capture of emails, calls, and stage changes closes manual entry gaps that distort benchmarks and hide true pipeline health.
- Teams ready to eliminate data gaps can automate activity capture with Coffee so every metric reflects verified data.
Tier 1: Coverage Metrics That Predict Future Capacity
Pipeline Coverage Ratio
Pipeline Coverage Ratio shows how much qualified pipeline you have against quota for a period. The formula is: Pipeline Coverage Ratio = Total Qualified Pipeline Value ÷ Period Quota, and only opportunities that meet budget, authority, need, and timeline criteria count. A common benchmark for typical B2B teams is 3×, with SMB teams targeting 2×–3× and mid-market teams targeting 3×–4×. The minimum required ratio equals 1 ÷ historical win rate. Missing deal values or unlogged opportunities change this ratio immediately and create a false sense of security.
Top 5 Dashboard Metrics: Quick Comparison Table
The table below summarizes the five core metrics every RevOps team should monitor weekly. It shows formulas and 2026 benchmarks for SMB and mid-market segments. Use it as a dashboard reference, then review each section for the red flags that signal when a metric has moved outside a healthy range.
| Metric | Formula | 2026 SMB Benchmark | 2026 Mid-Market Benchmark |
|---|---|---|---|
| Pipeline Coverage Ratio | Total Qualified Pipeline Value ÷ Period Quota | 2×–3× | 3×–4× |
| Win Rate | Closed-Won Deals ÷ Total Closed Deals | 28%–35% | 20%–28% |
| Sales Cycle Length | Sum of Days to Close ÷ Number of Deals Closed | 14–30 days | 30–90 days |
| Stage-to-Stage Conversion Rate | Deals Entering Next Stage ÷ Deals Entering Current Stage | Track vs. your own 4-quarter trailing average | Track vs. your own 4-quarter trailing average |
| Pipeline Velocity | (Opportunities × Avg Deal Value × Win Rate) ÷ Cycle Length | Baseline from trailing 90 days, flag >20% drop | Baseline from trailing 90 days, flag >20% drop |
Tier 2: Efficiency Metrics That Diagnose Execution
Pipeline Velocity
Pipeline Velocity shows how quickly your pipeline turns into revenue. Formula: (Number of Opportunities × Average Deal Value × Win Rate) ÷ Average Sales Cycle Length. Shortening cycle length by 20% increases velocity by 25% when other variables stay constant. SMB teams should set a 90-day trailing baseline and flag any week-over-week drop above 20%. Mid-market teams should segment velocity by ACV band because deal-value variance distorts blended numbers. Red flag: a high coverage ratio combined with declining velocity signals accumulating risk from aging deals, because the pipeline looks large but deals are stalling instead of progressing. This pattern often stays hidden when activity fields go unlogged, which stretches calculated cycle length, suppresses velocity, and hides a pipeline that is actually moving.
Stage-to-Stage Conversion Rates B2B
Stage-to-stage conversion rates reveal where deals fall out of your funnel. Formula: Deals Advancing to Stage N+1 ÷ Deals Entering Stage N, calculated per stage per period. SMB teams with sub-$10K ACV typically convert at the higher end of the win-rate range (around 31%), which suggests healthy mid-funnel performance, while mid-market teams sit closer to the middle of their range (around 24%). These benchmarks help you pinpoint where in the funnel deals are being lost. Red flag: a drop from Stage 2 to Stage 3 signals a qualification issue, and a drop from Stage 4 to Closed-Won signals a negotiation or competitive issue. You can only diagnose the drop-off point when stage transitions are logged accurately. When reps skip logging stage-change events, conversion rates collapse to zero for entire cohorts and funnel drop-off stays invisible until quota is already missed.
Win Rate
Win Rate measures how often you convert evaluated deals into customers. Formula: Closed-Won Deals ÷ Total Closed Deals (Won + Lost) over a defined period. Healthy B2B win rates fall between 20%–35%, with SMB teams at 28%–35% and mid-market at 20%–28%. Red flag: rates below 15% suggest lead quality problems or ICP misalignment, while rates above 40% may indicate under-qualification. When loss reasons remain unrecorded, which happens frequently with manual entry, you cannot explain win-rate trends and coverage targets based on win rate drift away from reality.
Sales Cycle Length
Sales Cycle Length shows how long it takes to close deals by segment. Formula: Sum of (Close Date − Create Date) across all Closed-Won deals ÷ Number of Closed-Won deals, segmented by ACV band. SMB deals usually close in two to four weeks, while mid-market deals take one to three months. B2B sales cycles have lengthened 22% since 2022, so teams that still use pre-2023 baselines already work with stale targets. Red flag: when 30% of open pipeline has been active longer than the 75th percentile cycle length for its segment, coverage ratios are overstated. Missing opportunity create-date stamps, which often occur when deals are backdated during manual entry, corrupt every cycle-length calculation that depends on them.
Opportunity Aging Red Flags
Opportunity aging highlights deals that have stayed open too long for their stage. Formula: Current Date − Opportunity Create Date, compared against the stage-specific SLA threshold for the segment. Based on analysis of 47,548 B2B deals, deals stalled beyond 28 days show roughly three times lower win rates (14.3% vs 43.2%), and risk compounds when multiple stages are overstayed. Stage SLA thresholds should come from each company’s historical data by stage and segment. Red flag: configure alerts at 80% of the stage SLA threshold, not only at breach. When last-activity dates never update because reps skip logging calls and emails, every deal appears fresh and aging analysis loses value.
Tier 3: Outcome Metrics That Validate the System
Pipeline Creation Velocity
Pipeline Creation Velocity shows how quickly new qualified pipeline appears. Formula: Total New Qualified Pipeline Created in Period ÷ Number of Days in Period, tracked weekly. Creation coverage, which equals total pipeline created divided by the revenue target for that period, should be calculated separately by segment (SMB, mid-market) because each has distinct win rates and cycle profiles. SMB teams should create enough pipeline to maintain 2×–3× coverage on a rolling 90-day basis, while mid-market teams should maintain 3×–4×. Red flag: two consecutive weeks of creation velocity below the level needed to sustain minimum coverage. Opportunities created late or never entered into the CRM cause this metric to undercount true pipeline generation.
Average Deal Size Movement
Average Deal Size Movement tracks how your typical deal value shifts over time. Formula: (Average Deal Value This Period − Average Deal Value Prior Period) ÷ Average Deal Value Prior Period, expressed as a percentage change. Track SMB and mid-market cohorts separately. An Optifai benchmark study of 939 B2B SaaS companies found that win rates compress as ACV rises, so downward deal-size drift also signals a shift toward harder-to-win segments. Red flag: a sustained decline of more than 10% quarter-over-quarter without a deliberate ICP change. When reps update deal values informally and never sync changes to the CRM, average deal size reflects the original estimate instead of the negotiated reality and pipeline value appears inflated.
Forecast Accuracy
Forecast Accuracy confirms whether your pipeline view matches revenue outcomes. Formula: |Actual Revenue − Forecasted Revenue| ÷ Forecasted Revenue, expressed as a percentage error, with a target below 10%. Organizations that maintain consistent high coverage ratios usually achieve higher forecast accuracy. SMB teams with high-velocity motions and strong conversion can hit accuracy targets at lower coverage multiples, while mid-market teams with longer cycles need higher coverage buffers to reach the same accuracy. Red flag: forecast error above 15% for two consecutive periods. Duplicate records inflate pipeline numbers and stale contacts distort conversion metrics, which turns forecast error into a lagging symptom of data quality failure instead of a pure sales execution issue. Coffee’s autonomous agent captures every interaction in real time and prevents the gaps that create forecast error, so your board deck reflects actual pipeline health, not CRM hygiene theater.
Get started with Coffee and run your forecast on complete data.
Pipeline Compare: Making Metrics Actionable Week Over Week
Pipeline Compare shows how your pipeline changes from one snapshot to the next. A Pipeline Compare view displays the delta between two pipeline snapshots, usually the current week versus the prior week, and highlights which deals progressed, stalled, were added, or were removed. This view requires a system that stores historical pipeline state, not only the current record. Legacy CRMs overwrite field values without preserving history, so true week-over-week comparison demands manual CSV exports and spreadsheet work.
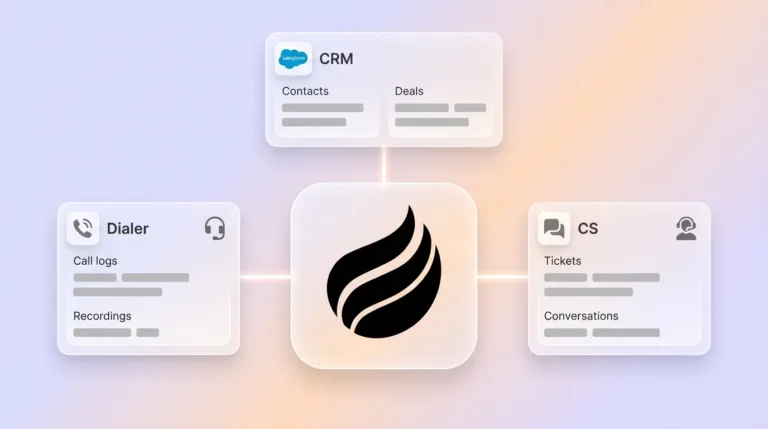
Coffee’s Pipeline Compare feature runs on a native data warehouse that captures every state change automatically. Because the Coffee Agent logs all interactions, including emails, calls, calendar events, and stage transitions, without rep input, the change log reflects real deal movement instead of whatever a rep remembered to update before the Monday review. This shift turns pipeline reviews from interrogation sessions into strategic discussions grounded in verified data.
Frequently Asked Questions
How does incomplete data entry affect pipeline coverage ratio?
Pipeline Coverage Ratio equals Total Qualified Pipeline Value divided by Period Quota. When deals never reach the CRM because reps do not log them, or when deal values stay blank or estimated and never updated, the numerator becomes wrong. A coverage ratio calculated on incomplete data can look healthy, for example 3.2×, while the true qualified pipeline sits below 2×. Duplicate records push the numerator in the opposite direction and create false confidence. The only way to trust a coverage ratio is to capture every qualified opportunity with an accurate value as soon as it is identified, which requires automated logging instead of periodic manual entry.
What is the minimum acceptable pipeline coverage for SMB teams in 2026?
The mathematical minimum equals 1 divided by the team’s historical win rate. For an SMB team with a 31% win rate, that floor is approximately 3.2×. Most RevOps leaders then add a 1.5×–2× risk buffer above that floor to cover late-stage slippage, which creates a working range of 2×–3×. Teams with win rates below 25% should recalculate their minimum quarterly, because a static 3× benchmark ignores compressed win rates driven by larger buying committees and stricter procurement.
How often should RevOps recalculate win-rate-based coverage targets?
RevOps should recalculate coverage targets based on win rate every quarter using a trailing-year view. Use the most recent four quarters of closed data, segmented by ACV band, to keep targets aligned with current performance. Annual recalculation falls behind because win rates shift with market conditions, rep tenure mix, and ICP changes. A team that moves upmarket mid-year will see win rates compress within two quarters, and coverage targets must adjust or the pipeline will appear covered while true close probability has dropped. Segment-level recalculation, with separate targets for SMB and mid-market, gives a more accurate picture than a single blended figure.
Can manual CRM updates ever keep stage conversion rates accurate?
Manual updates only keep stage conversion rates accurate under conditions that rarely exist. Every rep would need to log every stage change immediately, with no backdating, no skipped stages, and no deals that progress verbally before the CRM update. In reality, reps batch-update the CRM before pipeline reviews, which creates a record that reflects the review date instead of the actual transition date. This behavior compresses apparent stage dwell times, distorts conversion rate calculations, and hides the true drop-off stage. Automated capture, where stage changes are inferred from email content, call transcripts, and calendar events, is the only reliable way to maintain a complete, timestamped stage history at scale.
Conclusion: Turn Metrics into a Reliable Diagnostic Framework
The nine metrics covered here, Pipeline Coverage Ratio, Pipeline Velocity, Stage-to-Stage Conversion Rates, Win Rate, Sales Cycle Length, Opportunity Aging, Pipeline Creation Velocity, Average Deal Size Movement, and Forecast Accuracy, create a complete diagnostic framework for B2B pipeline health in 2026. Each metric has a precise formula, segment-specific benchmarks, and a clear red-flag threshold, which makes them powerful diagnostic tools when the underlying data stays accurate. Every one of these metrics breaks down when missing, stale, or manually entered CRM data replaces real activity, and the diagnostic framework collapses when the CRM no longer reflects reality.
Fixing the metrics without fixing the data does not work at scale. Harvard Business Review found that only 3% of enterprise data meets basic quality standards, and sales representatives lose approximately 500 hours annually to bad prospect data. The only scalable answer is an autonomous agent that captures every interaction, including emails, calls, meetings, and stage transitions, without turning humans into data entry clerks. Coffee’s Agent does this work, writes clean, timestamped, structured data back to your CRM or acts as the system of record, and keeps every metric in this framework tied to what is actually happening in your pipeline.
Get started with Coffee and run your next pipeline review on data you can trust.