Written by: Doug Camplejohn, CEO & Co-Founder, Coffee | Last updated: August 23, 2026
Key Takeaways for Catching Stalled Deals Early
- Revenue leakage from stalled deals is preventable. Seventy-two percent of B2B opportunities stall mid-to-late pipeline, and organizations lose an average of $12.9 million annually to poor data quality.
- A repeatable six-step Salesforce process surfaces at-risk opportunities using activity, relationship, and timing signals before the quarter closes.
- Clear risk criteria, Opportunity History tracking, and Einstein scoring combine into reliable risk bands (Healthy, Watch, At Risk, Critical) that trigger standardized rescue workflows.
- Operationalizing rescue plays through Salesforce tasks and Slack alerts ensures every flagged deal receives timely action instead of remaining in dashboards.
- Coffee automates the entire detection and rescue process continuously, eliminating manual reports and spreadsheets—see how Coffee handles this automatically.
Readiness Checklist Before You Build Reports
Confirm these prerequisites before you start building reports or scoring opportunities.
- Salesforce permissions: Report Builder access, Field History Tracking edit rights, and Einstein Opportunity Scoring enabled (Sales Cloud Growth or above).
- Must-populate fields: Stage, Amount, Close Date, Next Step, and Last Activity Date must be required fields on the Opportunity layout. Field completeness forms the baseline.
- Field History Tracking enabled: Stage, Amount, Close Date, and Probability must have history tracking on before any history-based report becomes meaningful.
- RevOps–rep ownership alignment: Agree in advance who owns the risk-scoring process, who reviews flagged deals, and what the SLA is for rescue actions. Without this alignment, reports become dashboards nobody acts on because no one knows who is responsible for follow-through.
Step 1: Define Concrete At-Risk Criteria
Precise criteria prevent both false positives and missed signals. Early pipeline risk signals fall into three categories: Activity Signals, Relationship Signals, and Timing Signals. Map each signal to a point value before you touch Salesforce.
Codify these warning signals.
- No logged activity in 14 days on a mid- or late-stage opportunity
- Stage age exceeding 2× the historical median days-in-stage for that stage and segment
- Close date pushed back two or more times with no new stakeholder engaged or milestone reached
- No identified economic buyer or executive sponsor
- Single-threaded opportunity (only one contact engaged)
- No confirmed next step with a future date
- Business pain not quantified in the opportunity record
- Proposals or pricing documents not viewed for 30 or more days
The following table translates these warning signals into a point-based scoring system that assigns each opportunity to a risk band and a required action.
| Risk Factor | Points | Risk Band | Required Action |
|---|---|---|---|
| No confirmed next step | 3 | 0–2: Healthy | Maintain cadence |
| No economic buyer identified post-discovery | 3 | ||
| Buyer engagement dropped for 14+ days | 3 | 3–5: Watch | Rep action required |
| Close date moved 2+ times | 3 | ||
| Procurement process unknown at proposal stage | 3 | 6–8: At Risk | Manager inspection |
| Stage age >2× historical median | 2 | ||
| Single-threaded opportunity | 2 | 9+: Critical | Escalate or disqualify |
| Close date moved once | 1 |
Point values and bands are adapted from standard B2B opportunity risk scoring structures.
Step 2: Build an Opportunity Report That Surfaces Stalled Deals
Create a new report in Salesforce Report Builder using the Opportunities with Activity report type. Apply the following filters to surface deals that show inactivity, missing next steps, or near-term forecast risk.
| Filter Field | Operator | Value | Purpose |
|---|---|---|---|
| Stage | not equal to | Closed Won, Closed Lost | Exclude resolved deals |
| Last Activity Date | less than | TODAY – 14 | Surface no-activity deals; any mid/late-stage deal with no logged activity in 14 days warrants review |
| Close Date | less than or equal to | TODAY + 90 | Focus on near-term forecast risk |
| Amount | greater than | 0 | Exclude unpopulated records |
| Next Step | equals | (blank) | Flag missing next steps |
Add these columns: Opportunity Name, Account Name, Stage, Amount, Close Date, Last Activity Date, Next Step, Owner, Days in Stage (formula field). Group by Owner for pipeline review meetings.
Save and Schedule the Stalled Deals Report
Save the report as Stalled Deals – Weekly Review in a shared RevOps folder. Schedule it to run every Monday at 7:00 AM and deliver to the RevOps distribution list and each sales manager. Pin it to the Sales Manager dashboard so it becomes the first view in every pipeline meeting. Apply the 2× median threshold established in Step 1 as a conditional highlight rule in the report.
Step 3: Add Opportunity History to See How Deals Deteriorate
The stalled deals report surfaces opportunities with no recent activity, yet it does not show how those deals deteriorated over time. To capture patterns like stage regression and close date slippage, you need historical field data.
Navigate to Setup > Object Manager > Opportunity > Fields & Relationships and enable Field History Tracking on Stage, Amount, Close Date, and Probability. Then build a separate Opportunity Field History report type and add it as a related report or joined report.
Use the history data to spot these patterns.
- Stage regression: An opportunity moving backward from Proposal to Discovery signals a qualification failure or competitive re-entry.
- Amount decrease: Amount decreases often signal scope reduction or competitive pressure and indicate higher risk than the current stage suggests.
- Close date slippage count: Count the number of times Close Date changed to a later date. Three or more pushes should trigger a mandatory qualification review.
- Stage age without history movement: If the Stage field shows no change for a period exceeding 2× the historical median, the deal is structurally stalled regardless of rep-reported confidence.
Step 4: Apply the Risk-Scoring Table Inside Salesforce
Create a custom Number field on the Opportunity object called Risk Score and a custom Picklist field called Risk Band (values: Healthy, Watch, At Risk, Critical). These fields store the calculated risk assessment for each opportunity.
Choose how to populate these fields based on your Salesforce edition. Teams with Salesforce formulas enabled can build a formula field that auto-calculates the score by summing IF() conditions for each risk factor defined in Step 1. Teams without formula field access run the scoring manually each Monday after the stalled deals report runs.
For manual scoring, RevOps opens each flagged opportunity, tallies points against the table from Step 1, and updates Risk Score and Risk Band. The manual process takes approximately 3–5 minutes per opportunity. Opportunity risk models should combine multiple independent signals rather than relying on a single score, because one anomaly may have an innocent explanation while several converging signals provide a reliable basis for intervention.
Step 5: Layer Einstein Predictive Insights on Top of Manual Scores
Enable Einstein Opportunity Scoring in Setup > Einstein > Opportunity Scoring. Einstein assigns each opportunity a score from 1–99 based on historical win and loss patterns, engagement data, stage velocity, and field completeness. AI-based risk detection can identify deal risks earlier than human managers notice the same signals.
Combine Einstein with the manual risk score using this decision rule.
- Einstein score below 50 AND manual Risk Band of Watch or higher: escalate to manager immediately.
- Einstein score above 70 AND manual Risk Band of At Risk or Critical: investigate data quality, because rep stage optimism likely exceeds what the activity data supports.
- Einstein score below 30 AND manual Risk Band of Healthy: re-score manually, since a field may be missing or incorrectly populated.
Add the Einstein Opportunity Score field to the stalled deals report as a column. Sort by Einstein Score ascending within each Risk Band to prioritize the most deteriorated opportunities first.
Step 6: Turn Risk Scores into Rescue Workflows
You now have a prioritized list of at-risk deals, yet a report alone does not save revenue. Risk scores without assigned actions produce no revenue, so define standardized save plays triggered by each risk band and route them through Salesforce tasks and Slack alerts.
The rescue intensity escalates with the risk band.
- Watch (3–5 points): The deal needs attention but can be handled by the rep alone. Send a re-engagement email within 48 hours, log a new Next Step with a date within 7 days, and update the opportunity record.
- At Risk (6–8 points): The deal now requires management involvement. The manager joins the next rep call, the rep multi-threads to a second stakeholder, and RevOps reviews close date accuracy and adjusts forecast category.
- Critical (9+ points): The deal demands executive intervention or disqualification. Executive sponsor outreach occurs within 24 hours, the deal is reviewed in the next pipeline meeting, and the opportunity is either rescued with a new compelling event or moved to Closed Lost to clean the forecast.
Use Salesforce Flow or Process Builder to auto-create tasks and send Slack notifications when Risk Band is updated. Risk alerts should be routed into team communication tools such as Slack and tied to explicit actions or SLAs rather than remaining in dashboards alone. Assign each task an owner and a due date at creation, because unowned tasks are never completed.
See how Coffee automates rescue workflows without manual task creation.
Scaling This Process for Different Team Sizes
The six-step process above represents the full implementation. Adjust scope based on team size and CRM maturity.
- SMB teams (under 10 reps): Use a 1.5× stage-age multiplier rather than 2× to catch stalls earlier. Run the stalled deals report bi-weekly rather than weekly. Skip the formula field and score manually in a shared spreadsheet until deal volume justifies the Salesforce build.
- Mid-market teams (10–50 reps): Implement the full formula field and automated Slack routing. Add a second report filtered by Amount greater than your average deal size to prioritize high-value at-risk deals separately.
- Basic Einstein (no conversation intelligence): Rely on the manual risk table as the primary signal and use Einstein as a secondary check. The recommended adoption order is to fix activity capture from email and calendar first, then layer in AI scoring, then add agentic automation.
- Advanced Einstein with conversation intelligence: Add competitor mention flags and talk-time ratio signals from call recordings as additional risk factors in the scoring table.
How Coffee’s Agent Layer Automates Detection and Rescue
The manual process described above requires a RevOps manager to run reports, score opportunities, create tasks, and send alerts every week. At scale, that work consumes 3–5 hours and produces a snapshot that is already hours old by the time it reaches a rep.
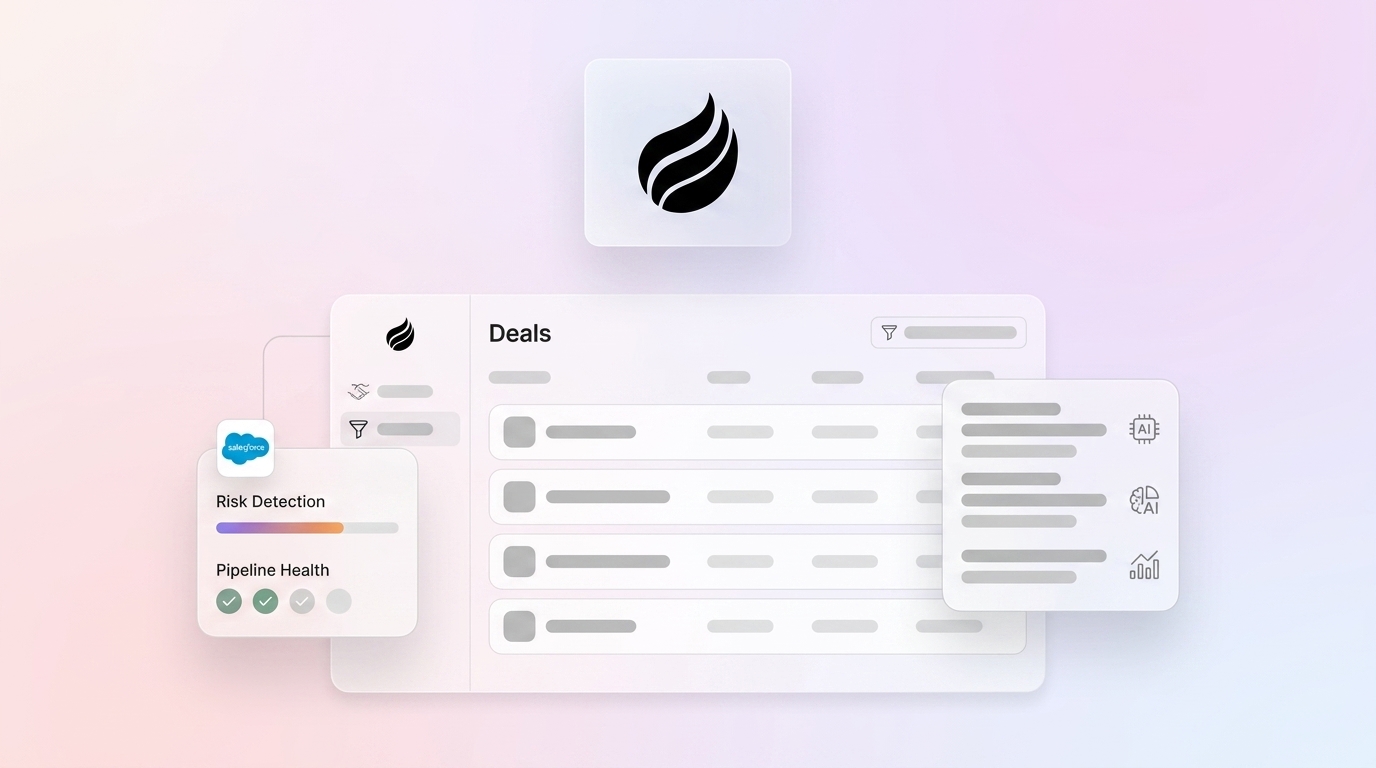
Coffee’s agent layer deploys on top of existing Salesforce instances and continuously monitors the same signals defined in Steps 1 through 6. The agent automatically logs activity from email and calendar, updates the Risk Score field when signals change, triggers Salesforce tasks and Slack alerts without human prompting, and surfaces a prioritized rescue queue inside Salesforce. Because the agent captures activity from emails, calls, and calendar events directly, the Last Activity Date field stays current without rep data entry, which eliminates the most common source of false negatives in stalled deal detection. Teams using AI deal intelligence tools report 8–25% increases in win rates and forecast accuracy improvements ranging from 75% relative gains to absolute rates of 90–95%.
Validation Criteria for Your At-Risk Deal Process
Measure whether the process works using these signals.
- Report accuracy: At least 80% of opportunities flagged as At Risk or Critical should either close, be rescued, or be moved to Closed Lost within 30 days of flagging. Persistent false positives indicate scoring criteria need recalibration.
- Time saved per week: Track RevOps hours spent on pipeline review before and after implementation. Sales managers spend 12 hours per week on manual reconciliation of CRM data. A functioning process should reduce this materially within 60 days.
- Adoption signals: Monitor report view frequency, task completion rates on rescue actions, and whether Risk Band fields are populated on more than 90% of open opportunities.
- Forecast variance reduction: Compare forecast-to-actual variance in the 90 days before and after implementation. Many companies report they cannot fully trust their revenue forecasts. A reduction in close-date slippage and no-decision losses is the primary business outcome to track.
Eliminate manual monitoring with Coffee, the agent layer that makes this process sustainable at scale.
Frequently Asked Questions
How often should the at-risk report be refreshed?
Most mid-market sales teams should refresh the report weekly on Monday morning as a minimum viable cadence. This timing keeps the report current before pipeline review meetings and gives reps the full week to execute rescue actions. Teams with high deal velocity or short sales cycles under 30 days should refresh the report twice weekly.
The stalled deals report should never be a static export. Schedule it in Salesforce to run automatically and deliver to managers so the cadence does not depend on anyone remembering to pull it. If you are using an agent layer like Coffee, the monitoring is continuous and the report reflects real-time activity data rather than a weekly snapshot.
Who owns the risk-scoring process—RevOps or sales reps?
RevOps owns the scoring model design, field configuration, and report infrastructure. Sales managers own the review cadence and rescue action assignment. Individual reps own execution of the assigned save plays and are responsible for keeping Next Step, Last Activity, and Stage fields current.
This division prevents the common failure mode where reps self-score their own deals optimistically and the risk model loses integrity. RevOps should audit score accuracy monthly by comparing Risk Band at the time of flagging against the eventual deal outcome and recalibrate point values when the model produces persistent false positives or misses.
Can Einstein replace the manual risk table?
Einstein Opportunity Scoring works as a strong complement to the manual risk table but not a replacement, particularly for teams with fewer than 40 closed-won and 40 closed-lost deals in Salesforce history. Einstein’s model is trained on historical patterns and engagement data, which means it performs best when CRM data quality is high and deal volume is sufficient.
The manual risk table captures qualitative signals, such as whether the economic buyer is identified or whether the procurement path is known, that Einstein does not score unless those fields are explicitly mapped. The most reliable approach combines both. Use the manual table for structural deal qualification signals and Einstein for engagement and velocity signals, then escalate when both sources flag the same opportunity.
What data quality is required before automation works reliably?
Automation built on poor CRM data produces unreliable alerts and erodes manager trust in the system quickly. Before enabling automated risk scoring or agent-layer monitoring, confirm that Stage, Amount, Close Date, and Last Activity Date are populated on more than 90% of open opportunities. Field History Tracking must be enabled before the process starts, because it cannot be backfilled.
Activity logging from email and calendar should be connected so that Last Activity Date reflects real buyer interactions rather than manual rep entries. If your team is starting from a low data quality baseline, run the manual scoring process for four to six weeks first to establish clean records, then layer in automation. As mentioned in the agent layer section, Coffee’s automatic activity capture solves the data quality prerequisite without requiring rep behavior change.