Key Takeaways
- Weekly pipeline tracking monitors deal stages, values, and velocity so you can spot growth patterns, stalled deals, and revenue risks early.
- Core metrics include pipeline value week-over-week growth, deal count by stage, win rates around 20–25%, and sales velocity trends.
- Use a 7-step process: define metrics, export snapshots, calculate changes, visualize trends, analyze insights, and then automate with AI.
- Avoid pitfalls like poor data hygiene and manual errors by using automated tools that deliver accurate, real-time pipeline views.
- Automate WoW tracking with Coffee’s AI Pipeline Compare to save 8–12 hours weekly and improve forecast accuracy.
Why Weekly Sales Pipeline Tracking Changes Results
Structured weekly pipeline reviews help teams using HubSpot, Salesforce, or other CRMs hit their revenue targets more consistently. Weekly tracking surfaces deal slippage, stalled opportunities, and coverage gaps before they threaten the quarter. Sales reps keep data current, managers run focused reviews, and RevOps maintains pipeline hygiene and forecast accuracy.
Readiness Check: What You Need Before WoW Tracking
Set up weekly pipeline tracking only after your CRM has clean data and clearly defined sales stages. You also need access to Google Workspace or Microsoft 365 for template management and basic Excel or Google Sheets skills. Manual setup takes about 15 minutes, while Coffee’s Pipeline Compare feature delivers instant automation for teams that want to avoid spreadsheet maintenance.
Ready to automate your pipeline tracking? Eliminate manual exports with Coffee’s automated tracking for instant WoW insights.
7-Step Process to Track Your Sales Pipeline Each Week
Once your CRM meets these prerequisites, you can roll out a consistent weekly tracking routine. Follow this systematic approach to monitor changes in your sales pipeline every week.
1. Define Key WoW Metrics for Your Team
Start by locking in the core metrics you will track every week.
| Metric | Description | WoW Formula | Target Range |
|---|---|---|---|
| Pipeline Value | Total monetary value of active deals | (Current Week – Prior Week) / Prior Week × 100 | Consistent positive growth |
| Deal Count by Stage | Number of opportunities per pipeline stage | (Current Count – Prior Count) / Prior Count × 100 | Balanced distribution across stages |
| Win Rate | Percentage of deals closed won | Current % – Prior Week % | 20–25% for inbound enterprise POC B2B sales motions |
| Sales Velocity | Revenue generation speed | (Deals × Win Rate × Deal Size) ÷ Cycle Length | Steady, increasing trend |
2. Export a Baseline Snapshot from Your CRM
Capture your starting point by exporting a complete pipeline report from your CRM. In HubSpot, go to Reports, then Deal Reports, and export all active opportunities with deal stage, value, close date, and last activity. Salesforce users should follow a parallel process using the Opportunity Report with the same fields to keep data consistent. After you export the report, move the data into a Google Sheet template with automated charts so you have a single source of truth for trends and week-over-week percentage changes.
3. Capture Week 2 Data for Comparison
Repeat the export exactly one week later using the same filters and timing so comparisons stay accurate. Record which deals moved between stages, which new opportunities entered the pipeline, and which deals closed or were marked lost. Save screenshots of key CRM views to keep a visual record of how the pipeline changed.
4. Calculate Week-over-Week Changes
Apply the WoW formulas to highlight meaningful movement in your pipeline. Use Excel formulas such as =((B2-A2)/A2)*100 to calculate percentage growth or decline automatically. Add conditional formatting that marks progressed deals in green, stalled deals in yellow, and deals that moved backward in red. Pay special attention to deals that sit in a stage more than 50% longer than your historical averages.
5. Visualize Trends in a Simple Dashboard
Turn your numbers into clear visuals that your team can scan quickly. Build charts that show pipeline value trends, changes in stage distribution, and patterns in deal progression. Create a weekly dashboard that displays total pipeline value, new additions, deals that advanced, and stalled opportunities. Use color-coded visuals so week-over-week changes stand out immediately for stakeholders.
6. Analyze Insights and Spot Risks
Use your dashboard to pinpoint red flags before they affect your number. Watch for deals stalled beyond normal timeframes, pipeline coverage below 3–4x quota, which signals quota risk for most sales organizations, declining stage conversion rates, or longer sales cycles. Prioritize deals with no recent buyer engagement, missing key stakeholders, or forecasted close dates that approach without visible progression.
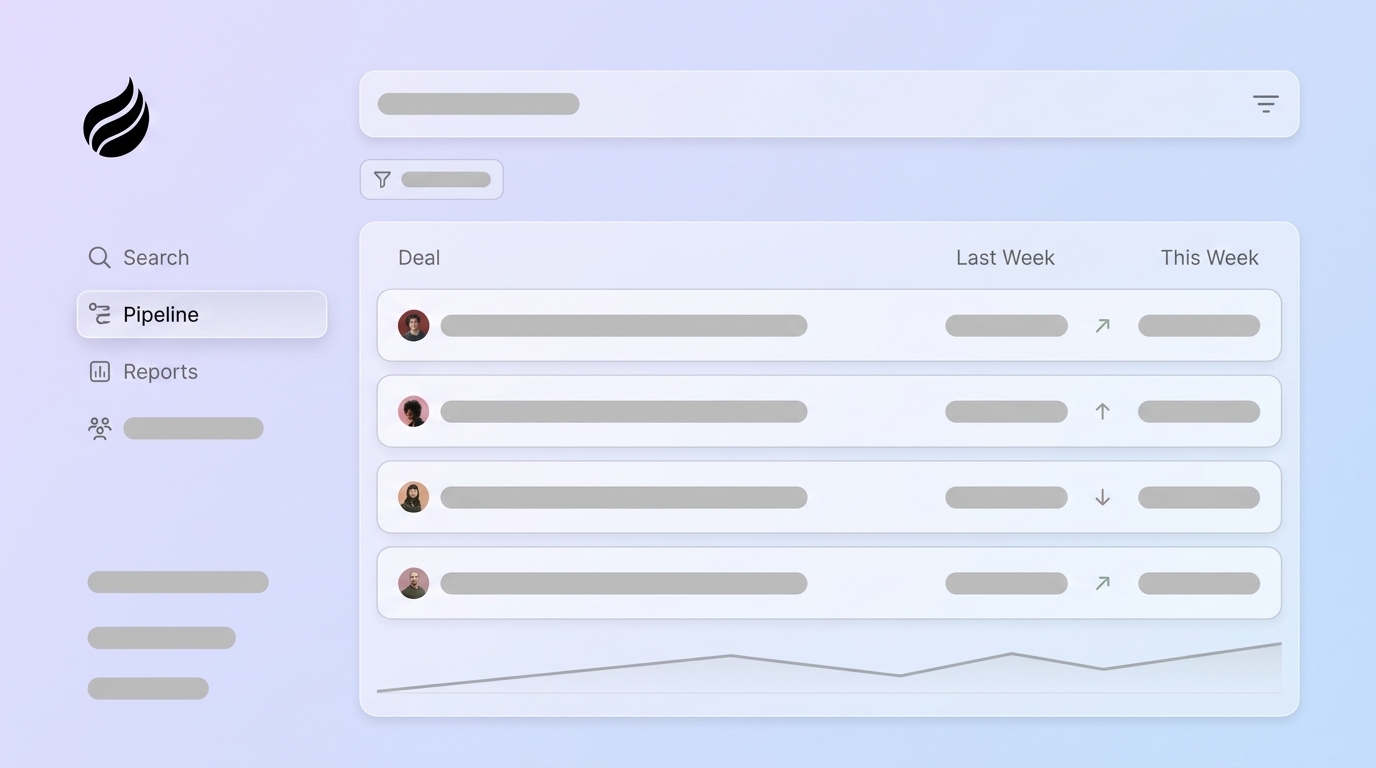
7. Automate Weekly Tracking with AI
Move beyond manual tracking by handing repetitive work to Coffee’s Pipeline Compare feature. Coffee automatically captures email interactions, call logs, and deal progression directly from your systems. The AI agent provides instant WoW visuals without requiring CSV exports, tracks pipeline changes continuously, and delivers insights based on complete activity data. Automation performs best when your CRM data stays clean, so reliable inputs still matter for confident decisions.
Common Weekly Pipeline Tracking Mistakes and Fixes
Manual tracking often breaks down because legacy CRMs lack historical data, deal information stays unstructured, and sales teams resist extra admin work. Many pipelines look healthy on paper yet contain large numbers of “active” deals that have not seen replies in weeks. These zombie deals inflate pipeline value and hide real risk. Coffee’s Agent logs interactions automatically, enriches deal records, and keeps pipeline hygiene high without extra effort from reps.
Eliminate spreadsheet maintenance and manual tracking errors. Switch to automated pipeline intelligence and reclaim your time.
Validate Success and Measure Impact
Effective WoW tracking produces charts that mirror real business conditions and reduce surprises at the end of the quarter. Teams often save 8–12 hours per week that previously went into manual data entry and spreadsheet updates. Forecast accuracy improves because coverage, deal health, and velocity stay visible in one place. Coffee users report major time savings and clearer pipeline visibility, including one $10M+ ARR company that fully automated weekly pipeline reviews with the platform’s AI-driven insights.
Scale Weekly Tracking for Any Team Size
Teams of different sizes can adapt the same approach with tools that fit their stack. Small businesses use Coffee’s Standalone CRM for end-to-end pipeline automation. Mid-market teams run Coffee as a Companion App alongside Salesforce or HubSpot. Many teams follow the 3-3-1 rule: maintain 3x pipeline coverage, track 3 core metrics weekly, and run 1 focused review session to keep pipeline management sustainable.
FAQ
What is a sales pipeline tracking template?
A sales pipeline tracking template is a structured spreadsheet or dashboard that organizes deals by stage, value, close date, and activity history. Strong templates include automated formulas for week-over-week changes, conditional formatting for stalled deals, and charts that show pipeline trends. Typical columns include deal name, stage, value, probability, last activity date, and next steps. Templates work well for small teams, yet they become hard to maintain as volume grows because every update requires manual effort.
How does Coffee automate WoW tracking?
Coffee’s AI Agent captures sales activities from email, calendar, and call systems so reps do not need to log data manually. The Pipeline Compare feature provides instant week-over-week visualizations that show deal progression, stalled opportunities, and pipeline value shifts. Building on the automation described in Step 7, Coffee’s Pipeline Compare continuously monitors all sales activities and generates visualizations in real time, removing the weekly export ritual entirely. The Agent updates deal stages based on activity patterns and surfaces insights that would normally take hours of manual analysis.
What are the most useful pipeline metrics for 2026?
Modern teams focus on sales velocity to understand revenue speed, pipeline coverage ratio to confirm enough opportunity volume, and deal progression rates to find bottlenecks. Advanced teams also track AI-powered deal health scores that reflect stakeholder engagement and buyer sentiment. Time-in-stage metrics highlight stalled opportunities, while conversion rates between stages show where deals drop. Leading indicators such as email engagement, meeting frequency, and stakeholder involvement give early warnings about deal health.
How do you improve stalled deal detection?
Improve stalled deal detection by setting automated alerts for deals that sit in a stage 50% longer than normal. Track days since the last meaningful buyer interaction and monitor email engagement for falling response rates. Define clear criteria for stage progression and automate follow-up sequences for inactive opportunities. Use AI tools to review conversation sentiment and stakeholder engagement so you can flag at-risk deals before they fully stall. Regular pipeline hygiene sessions that review qualification and next steps prevent zombie deals from clogging forecasts.
What is pipeline coverage ratio and why does it matter?
Pipeline coverage ratio compares total pipeline value to sales quota, calculated as total open pipeline divided by revenue target. As mentioned earlier, the 3–4x coverage benchmark varies by sales motion, with enterprise sales typically requiring 3x pipeline coverage as a standard benchmark. Transactional sales with cycles under 30 days and 30–40% win rates often need 2.5x–3.5x coverage. This ratio accounts for slippage, competitive losses, and timing delays that occur naturally in sales. Low coverage early in the quarter signals a need for more prospecting and top-of-funnel activity.
Conclusion: Turn WoW Tracking into a Strategic Advantage
Manual week-over-week pipeline tracking through spreadsheets and CSV exports wastes the 8–12 hours weekly that automation could return to selling. The 7-step process above gives you a solid framework for consistent pipeline monitoring, and Coffee’s AI Agent amplifies that framework with automation. You shift pipeline management from a time-consuming admin chore into a strategic system that supports predictable revenue growth.
Start with Coffee’s agent-led pipeline intelligence today. Try Coffee’s AI Pipeline Compare and reclaim hours of selling time while gaining deeper pipeline insights.