Key Takeaways for Automated Opportunity Health
- Manual opportunity tracking creates zombie deals, so use Pipeline Inspection, stage age alerts, and velocity calculations for accurate forecasts.
- Track stage age, pipeline velocity, win rate, and coverage ratio through dashboards and custom formula fields for consistent visibility.
- Enable Opportunity History Tracking on Stage, Amount, and Close Date to audit deal progression and uncover risk patterns.
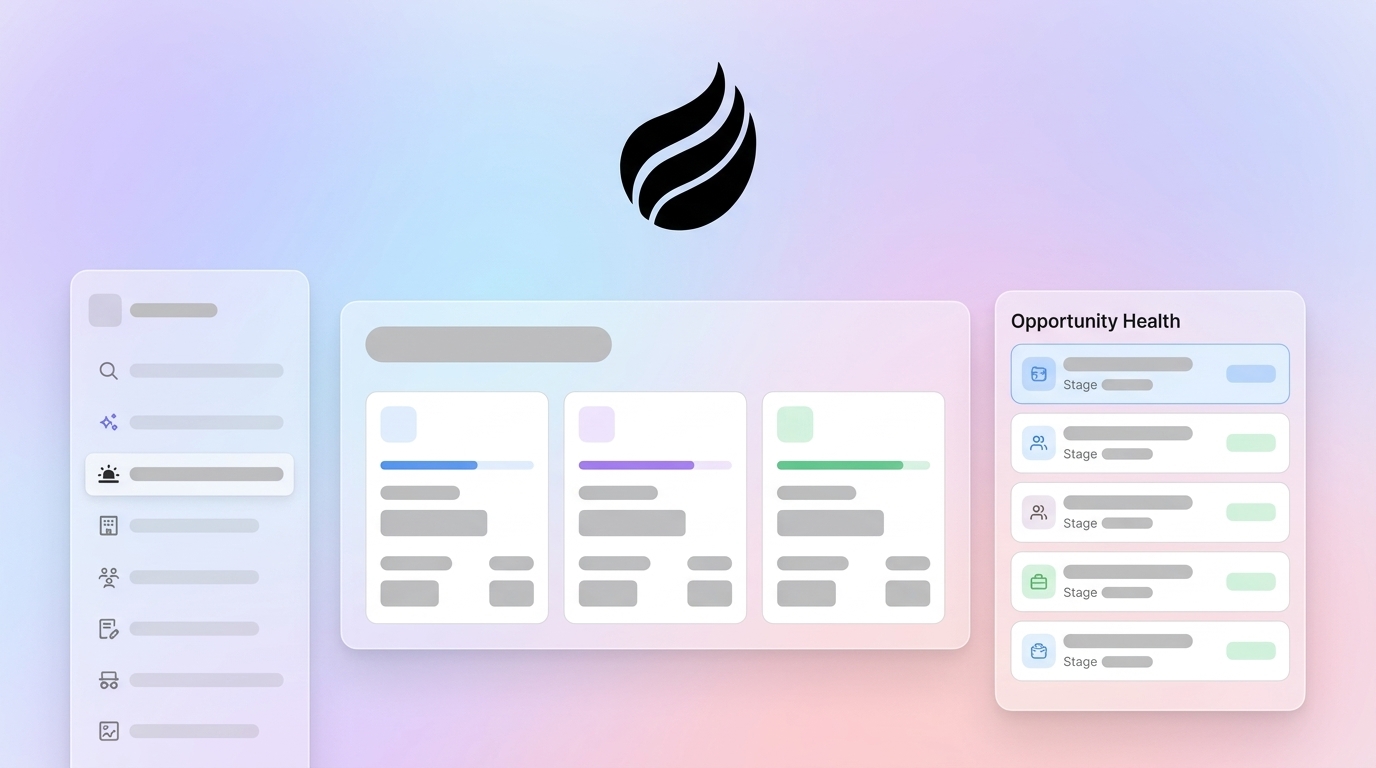
- Coffee’s AI agent delivers zero-setup automation, capturing email and call insights and generating health scores that outperform native Salesforce tools.
- Implement these methods to save 8–12 hours weekly on reviews, and start automating your pipeline intelligence today.
Why Reliable Opportunity Health Signals Matter
RevOps managers need reliable signals for weekly pipeline reviews, yet manual tracking produces inconsistent data quality. Seventy-nine percent of sales organizations miss their forecast by more than 10%, often because stalled deals remain weighted in pipeline calculations. Modern AI agents reduce CRM data fragmentation by automatically capturing email interactions and call insights that traditional systems miss.
Undetected stalled opportunities often slip to the next quarter and create compounding revenue leakage. Spreadsheet-based reviews rarely surface these risks quickly enough to correct course. Automated health tracking replaces interrogation-style pipeline meetings with focused conversations about advancing specific deals.
Readiness Checklist Before You Automate
Effective opportunity health tracking starts with Salesforce admin access and clearly defined stage criteria with consistent entry and exit rules. With these foundations in place, connect Google Workspace or Microsoft 365 for email activity capture so the system can log engagement signals automatically. Finally, establish data quality baselines such as a total email bounce rate below 2% per campaign for healthy sender reputation, because poor deliverability distorts contact engagement metrics.
Timeline expectations differ by approach. Native Salesforce setup usually takes 1–2 hours for Pipeline Inspection and history tracking configuration. AI agent integration such as Coffee typically requires a simple 5-minute authentication. Clean stage definitions and accurate historical close dates provide a solid base before you introduce automated alerts.
Teams that already meet these prerequisites can move directly to automation. Try Coffee’s zero-setup approach to opportunity health tracking and start capturing signals immediately.
7 Best Ways to Track Salesforce Opportunity Health
1. Use Native Pipeline Inspection for Deal Movement
Salesforce’s Pipeline Inspection tool tracks opportunity evolution by showing deals added, removed, pushed, or closed since your last review. Access it through Reports > Pipeline Inspection to visualize stage duration and progression patterns without exporting data to spreadsheets.
Configure stage duration alerts using custom formula fields that calculate days in the current stage. Once these baseline calculations exist, set automated alerts when deals exceed typical stage duration by a meaningful margin, because extended stalling usually correlates with lower close probability. Pipeline Inspection then enhances this monitoring with visual heat maps that show deal concentration and movement trends at a glance.
2. Turn On Opportunity History Tracking for Audit Trails
Opportunity History Tracking creates a detailed audit trail of every key change. Enable it through Object Manager > Opportunity > Fields > Set History Tracking so Salesforce records each stage change, amount modification, and close date shift with timestamps and user attribution. These records reveal patterns such as frequent close date slippage or stage regression that signal deal health issues.
Configure tracking on critical fields including Stage, Amount, Close Date, and Probability. This audit trail supports forensic analysis of deal progression and highlights reps who skip qualification stages or commit to unrealistic close dates.
3. Monitor Core Health Metrics Like Stage Age
The following table outlines five core metrics to monitor, how to calculate them, and the thresholds that indicate a deal or pipeline segment needs attention.
| Metric | Formula/Benchmark | Red Flag Threshold |
|---|---|---|
| Stage Age | Days in current stage | High percentage of pipeline aged beyond typical stage duration |
| Pipeline Velocity | (Opportunities × Deal Size × Win Rate) / Cycle Length | Declining quarter-over-quarter |
| Coverage Ratio | Interest coverage ratio, a common coverage ratio, = EBIT / Interest Expense | Below 1.5x coverage |
| Win Rate | Closed Won / Total Closed | Below 15% (qualification issues) |
| Data Quality Score | Email Bounce Rate Proxy | >5% bounce rate |
Create dashboard widgets that track these metrics and trigger automated alerts when thresholds hit red-flag levels. Stage age analysis surfaces deals that need immediate action, while velocity trends provide an early read on quarterly forecast accuracy.
4. Build Custom Opportunity Health Scores
Custom health scores combine multiple signals into a single, easy-to-scan value. Use inputs such as pipeline velocity trending up quarter-over-quarter, stage conversion rates at least 50% of historical norms, and activity recency within seven days. Implement a Salesforce formula such as (Stage_Progress_Score × 0.3) + (Activity_Score × 0.4) + (Timeline_Score × 0.3) to automate scoring.
Einstein Activity Capture adds some automation but still relies on manual field mapping and cannot fully process unstructured email and call content. Custom scoring closes part of this gap by incorporating engagement signals that Einstein overlooks.
5. Use Dashboards and Pipeline Velocity Reports
Dashboards translate raw metrics into clear visuals for managers and reps. Configure Kanban views that show deals by stage with color-coding for health scores. Create Pipeline Compare visualizations that track week-over-week changes in deal progression, new additions, and stalled opportunities. Use List Views with filters for deals that exceed stage duration benchmarks.
Build velocity reports using the pipeline velocity formula from the metrics table above to measure pipeline throughput in real time. Schedule dashboard refreshes at least hourly so health metrics stay current during active selling hours.
6. Track Activity and Contact Role Engagement
Activity and stakeholder engagement patterns provide strong signals about deal health. Track engagement through Activity History and Contact Role progression, and monitor response times to leads, because responding to leads within five minutes significantly improves win rates. Flag deals with no activity for 10 or more days, and watch for contact role expansion as a sign of healthy deal progression.
Manual activity logging often leaves gaps when email threads and call insights do not sync automatically. This fragmentation produces incomplete health assessments and hides early risk signals that should trigger intervention.
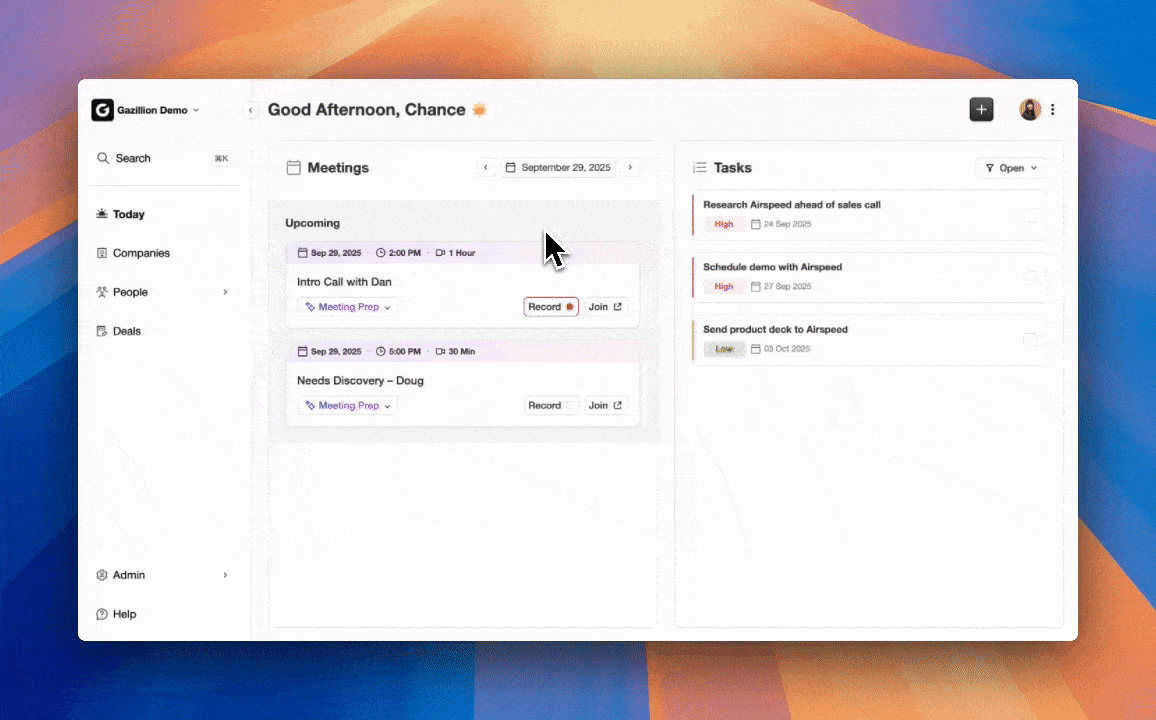
7. Automate Opportunity Health with Coffee Agent
Full automation solves the manual tracking gaps by capturing every interaction without relying on rep input. Coffee’s AI agent delivers zero-setup opportunity health tracking through simple Salesforce authentication. The agent automatically logs email activities, generates BANT and MEDDIC qualification summaries, and creates Pipeline Compare visuals that show week-over-week deal progression.
Coffee’s agent solves the fragmentation problem mentioned earlier by capturing unstructured data from emails and calls that Salesforce cannot process natively. AI search functionality answers natural-language questions like “Which deals are stuck in negotiation?” and returns instant health insights. The agent flags stalled deals automatically and generates predictive health scores based on engagement patterns.
When deals stall without clear next steps, Coffee’s agent identifies missing stakeholder engagement and suggests re-qualification activities. The Pipeline Compare feature then highlights which deals require immediate attention through clear visual progression tracking.
Validation and Success Criteria for Your Setup
Validation starts with confirming that stage history captures all transitions, automated alerts fire at the correct thresholds, and dashboard visuals match the underlying data. Success metrics include saving 8–12 hours per week on manual pipeline reviews and achieving adoption rates above 90% among sales reps.
A Coffee customer generating tens of millions in revenue provides a useful reference point. This company replaced spreadsheet-based pipeline management after implementing Coffee’s automated health tracking and achieved consistent forecast accuracy through agent-driven data quality.
Scaling Automated Opportunity Health Across Team Sizes
Team size influences which approach makes the most sense. Small teams with 1–5 reps can start with native Pipeline Inspection and basic stage age formulas. Teams with 1–20 reps usually benefit from Coffee’s Standalone CRM with built-in health automation. Mid-market organizations with 20 or more reps gain the most from Coffee’s Companion App combined with Salesforce Flows and Einstein AI for broad pipeline intelligence.
Scaling also introduces questions about data volume processing, user permission management, and integration complexity. Coffee’s agent-based approach scales automatically with team growth and handles higher interaction volumes without additional configuration.
Frequently Asked Questions
How do I view Salesforce opportunity history?
Navigate to Object Manager > Opportunity > Fields & Relationships, then click “Set History Tracking” to enable field-level audit trails. Select fields such as Stage, Amount, and Close Date for tracking. View history on individual opportunity records under the “History” related list, which shows all changes with timestamps and user details.
What are the most important opportunity health metrics?
Key metrics include stage age in days, pipeline velocity that reflects deal flow speed, coverage ratio that compares pipeline value to quota, win rate by stage, and activity recency. Tracking these metrics together across all opportunities provides a comprehensive view of pipeline health.
Does Coffee work with existing Salesforce instances?
Yes, Coffee’s Companion App integrates with existing Salesforce installations through simple authentication. The agent writes enriched data and insights back to Salesforce while preserving your current workflow and field structure. No data migration or complex setup is required.
How does Coffee compare to Einstein for opportunity health?
Einstein depends on manual data entry and field mapping, while Coffee’s agent automatically captures email interactions and call insights. Coffee processes unstructured data that Einstein cannot handle natively, which enables more complete health scoring through automated activity logging and engagement analysis.
What about security and pricing for automated health tracking?
Coffee maintains SOC 2 Type 2 compliance and GDPR standards for data security. Pricing follows a straightforward seat-based model where you pay for human users, and the agent’s unlimited labor is included. No complex metering on AI usage or data processing volumes appears in the pricing.
Conclusion: Move from Manual Tracking to Automated Health
These seven methods turn manual opportunity health tracking into a repeatable, automated pipeline intelligence system. Coffee’s AI agent leads this shift by removing data entry work while delivering comprehensive health insights. Track Salesforce opportunity health with far less effort and far more accuracy, and explore Coffee’s pricing and implementation options to see what fits your team.
Teams ready to modernize revenue operations can act now. See how Coffee can transform your revenue operations and choose a plan that supports your growth.